Reporters and industry observers always seek a simple answer to the question of: How many chargers do we need in the US? This often leads to the flawed and over-simplistic calculation of the ratio of EVs in operation to the number of charging ports.
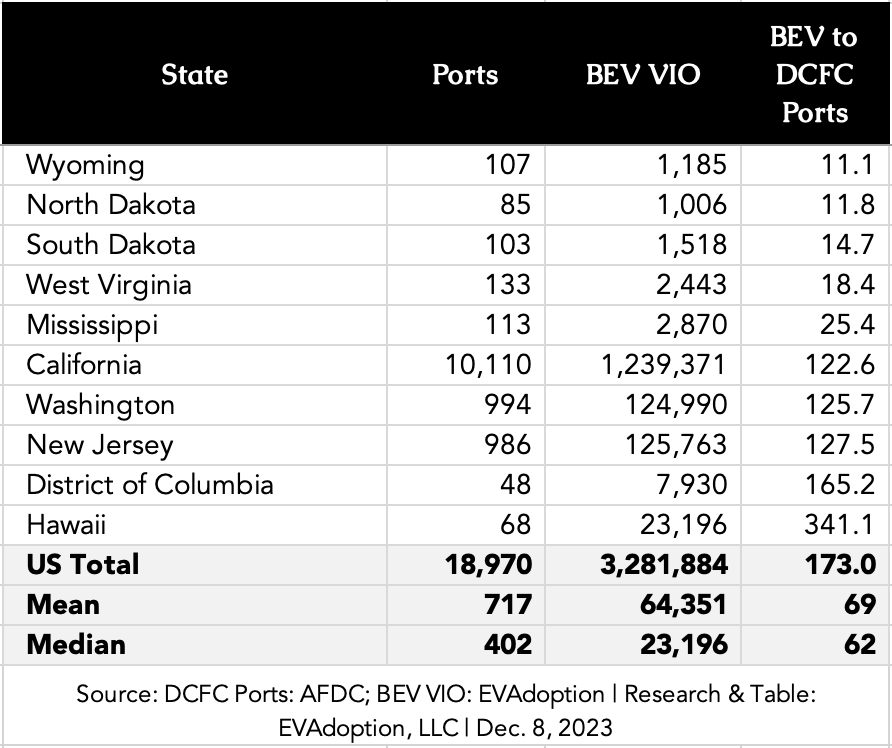
We have, however, tracked and calculated this metric for years, and a reporter recently asked for the data, so we updated the math. Below is a table showing the “best” and “worst” five states when calculating the ratio of BEVs in operation to DC fast charging (DCFC) ports. (Note: Vehicles in operation (VIO) — and also known as car parc — is the number of total registered vehicles in a market. EVAdoption estimates and calculates this data quarterly.)

You’ll quickly notice that the states with the “best” (lowest) ratio are rural and lower median-income states that have very low levels of EV adoption. In these states, the number of deployed DC fast chargers has simply outpaced BEV sales. DCFCs have been deployed, often from available grant programs and networks wanting to have at least a minimum presence in the state. But with BEV sales being so tiny, it makes the ratio look good.
On the other hand, the states with the highest and “worst” ratios tend to be those with high EV adoption and/or large populations. Or they are states/territories like Hawaii and the District of Columbia that have both very high EV adoption rates and unique geographic characteristics. For the District of Columbia, most EV drivers live in the surrounding states of Virginia and Maryland, and will charge at home or at fast charging stations in those states. For Hawaii, the islands tend to be rather small from a driving distance perspective — so most BEV owners likely have Level 2 chargers at home (perhaps also with solar) and can easily replenish their EV’s battery without the need for DCFCs. And there is no such thing as a 500-mile road trip on the island of Maui.
California and Washington have very high levels of EV adoption and high median incomes, resulting in a high percentage of EV owners likely able to rely on Level 2 charging at home, the workplace, or retail locations. California, of course, has by far the most EVs on the road and the highest number of DC fast chargers. The state could use more DCFCs relative to the current number of EV drivers, with wait times during holiday travel periods, and at some urban DCFC locations during busy commute hours.
We believe that the “test laboratory” of California, combined with the Tesla vehicle population, and charging stations (both Supercharger and Destination Charging networks), might provide the most beneficial learning from the BEV to fast charger ratio. We last calculated this metric about a year ago, and the ratio was 128 Teslas to 1 Supercharger, 95 Teslas to Superchargers + Tesla Level 2 Destination chargers, and 20 Teslas to Superchargers + all Public Level 2.
Overall, however, we believe the “EVs to charger” ratio is too simplistic and there are too many variables across states and regions (home ownership, income, geography, driving patterns/distance traveled, etc.) to make this an accurate assessment and predictor of how many charging stations are needed in a state or market. It also suggests that any solid formula would need to have different inputs and variables depending on the state/market.
Following are some related articles we’ve written over the years.
- How Many Public EV Chargers Will Be Needed in 2030?
- EVs Have A Better Ratio to Charging Ports Than ICE Vehicles to Gas Pump Nozzles
- 8 Factors That Will Affect the Number, Type and Location of Charging Stations Needed to Support Electric Vehicles
- What Is The “Minimum Acceptable” Ratio Of EVs to Charging Stations?
 Announcing the acquisition of EVAdoption by Paren →