Search
Close this search box.

Charging Stations By State

Charging Statistics By State - September 31, 2021

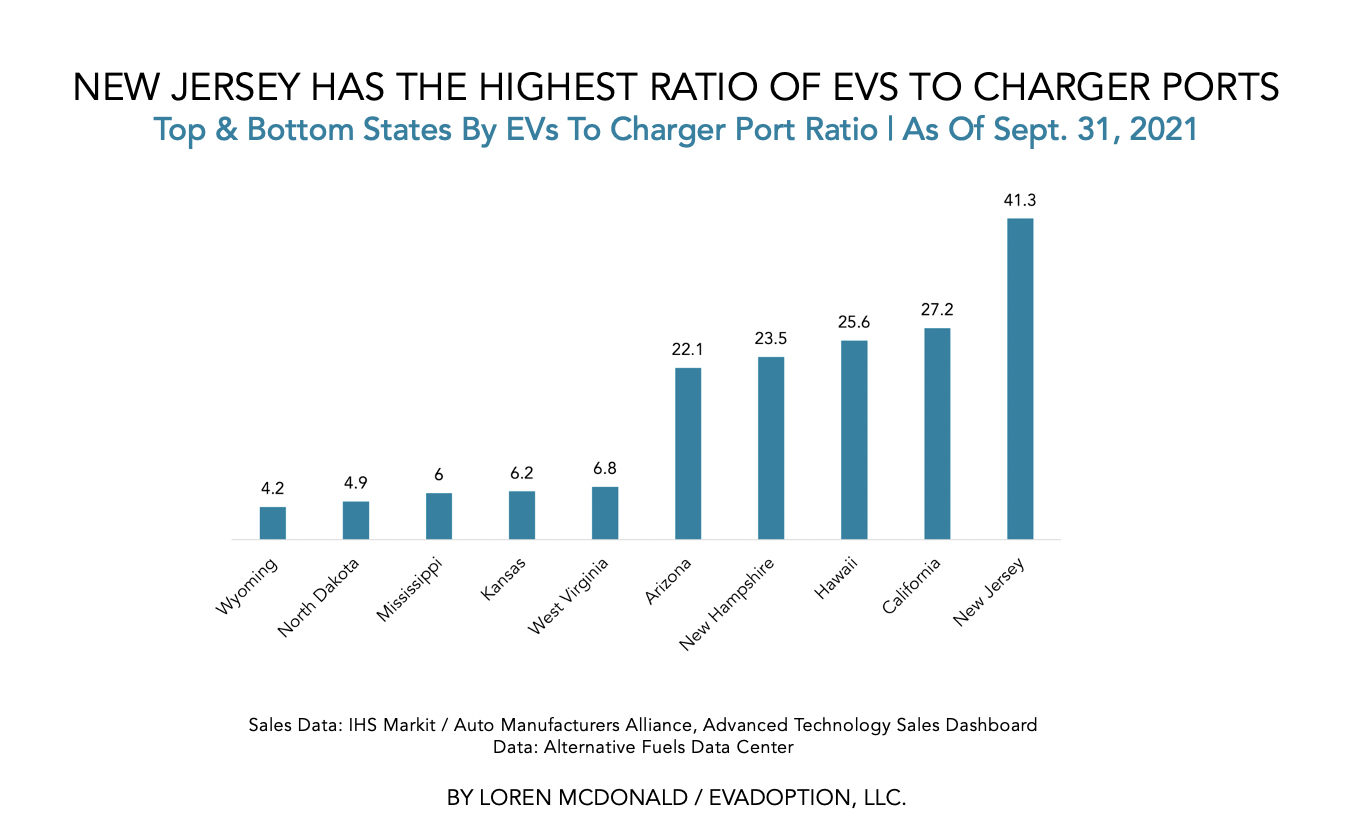
As of September 31, 2021 there were 2,147,070 electric vehicles (BEV and PHEV) in the United States and 109,307 charger ports. The following table shows the number of charger ports, EVs sold in the US through September 31, 2021, and the ratio of EVs to charger ports per state and the District of Columbia.

The median ratio was 14.2 EVs to ports, with Wyoming having the best (lowest) ratio at 4.2 to 1 and New Jersey had the worst (highest) at 41.7 to 1.

1) Ports: Number of individual charging plugs, sockets, connectors. While some DC fast chargers have multiple connectors/cables — the majority of the charging networks report this data to the AFDC as a single”port” ability to charge at one time. Alternative Fueling Station Locator As of September 31, 2021.

2) Cumulative EVs (BEV and PHEV) 2011 to September 2021 – Source: Alliance for Automotive Innovation (2021). Advanced Technology Vehicle Sales Dashboard. Data compiled by the Alliance for Automotive Innovation using information provided by IHS Markit (2011–2018, Nov 2019–2021) and Hedges & Co. (Jan 2019–Oct 2019)., Advanced Technology Vehicles Sales Dashboard)

StateTotal EVs (2)Level 1 Ports (1)Level 2 Ports (1)DCFC Ports (1)Total Ports (1)
Ratio: EVs to Charger Ports
California930,81128027762614334,18527.23
Florida108,74935455710525,64419.27
New York106,0241557747586,54716.19
Washington80,3978029857003,76521.35
Texas78,5853241247904,94615.89
New Jersey66,5551410955011,61041.34
Georgia53,41620029945603,75414.23
Massachusetts51,8341337263714,11012.61
Illinois49,7461317864522,25122.1
Colorado47,6336127885063,35514.2
Oregon44,1704416804182,14220.62
Arizona43,171115424091,95222.12
Pennsylvania42,6111419684562,43817.48
Maryland41,8932122905042,81514.88
Virginia39,7245117866702,50715.85
North Carolina32,7821518384342,28714.33
Michigan31,7532712273881,64219.34
Ohio31,654714673331,80717.52
Connecticut23,353219092861,21619.2
Minnesota20,393719502051,22616.63
Hawaii19,24356628475125.62
Nevada18,44149062991,20915.25
Utah16,521215611951,7589.4
Wisconsin15,4157865315088117.5
Tennessee14,8911011522191,38110.78
Missouri14,684518252152,0457.18
Indiana13,995058924183016.86
Oklahoma10,712631565497510.99
South Carolina8,982359916776911.68
New Hampshire7,17152118930523.51
Vermont7,06171685758318.5
Maine6,486640412753712.08
District of Columbia6,13318614396719.14
Alabama6,08103869448012.67
Kansas5,84828251109376.24
Iowa5,8282334315752311.14
Kentucky5,45883088339913.68
New Mexico4,842426812539712.2
Delaware4,73321808927117.46
Rhode Island4,69520466355219.01
Louisiana4,37242548133912.9
Nebraska4,07572647434511.81
Idaho3,76901808026014.5
Arkansas3,1270346664127.59
Montana2,27829910220311.22
West Virginia1,7951196692666.75
Mississippi1,6890211702816.01
Alaska1,11307388113.74
South Dakota1,015084631476.9
Wyoming707490751694.18
North Dakota656073611344.9
Median14,684768519593714.2
Average42,09925.61,7273912,14314.6
Total2,147,0701,30588,07019,932109,307

Chart: States with Lowest & Highest Ratio of EVs to Charger Ports

The state of New Jersey, which as as of September 31, 2021 had the 6th most cumulative EVs in the US, had the highest (worst) ratio of EVs to charger ports at 41.3 to 1. In a distant second place, California with 930,811 cumulative EVs, had a ratio of 27.2 to 1 charger port.

Wyoming had the best (lowest) ratio at 4.2 to 1 and North Dakota was second best with a ratio of 4.9 to 1. In general, states with a low percentage of EVs also have a low ratio suggesting that EV charging infrastructure tends to outpace EV sales until the sales and sales share starts to scale. And several states with a high EV sales share and/or sales share tend to have a relatively high ratio of EVs to charger ports.  Among the states with the worst ratio, New Hampshire is a bit of an outlier as its EV sales share only ranks the state in 24th spot.

For our latest articles, charts, & commentary

subscribe to
our NEWSLETTER

receive 54-pg: state of evs in the us