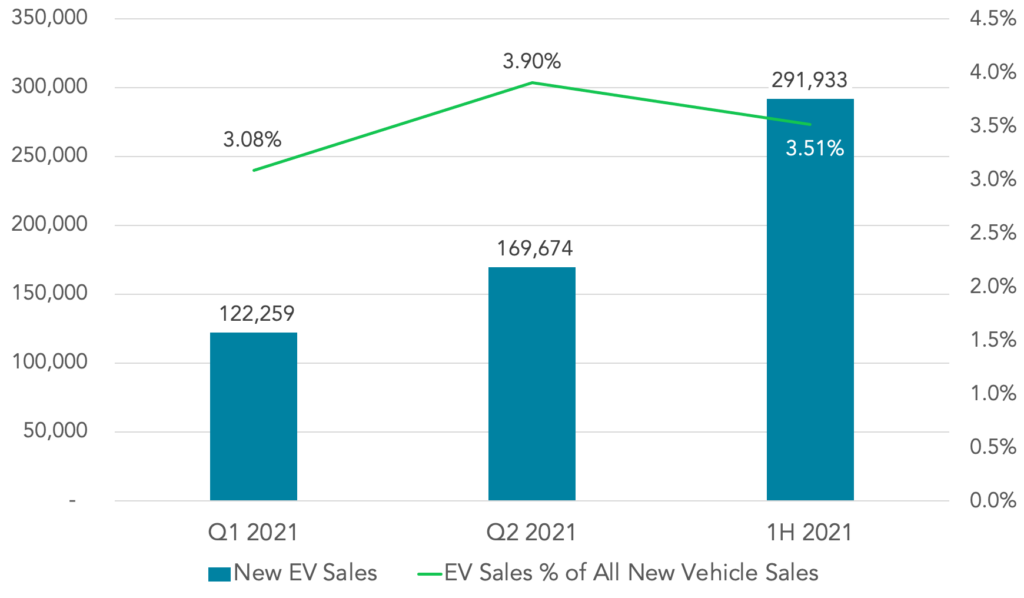
Despite the continued global chip shortage and lingering concerns and uncertainty about the Coronavirus pandemic, the first half of 2021 saw record sales of electric vehicles, according to the just released EVAdoption report, US Electric Vehicle Sales Report: 1H 2021. From January 1 to June 30, 2021 an estimated 291,933 BEVs and PHEVs (plug-in electric vehicles) were purchased, roughly 30,000 below the 320,000 average for the full years of 2018-2020.


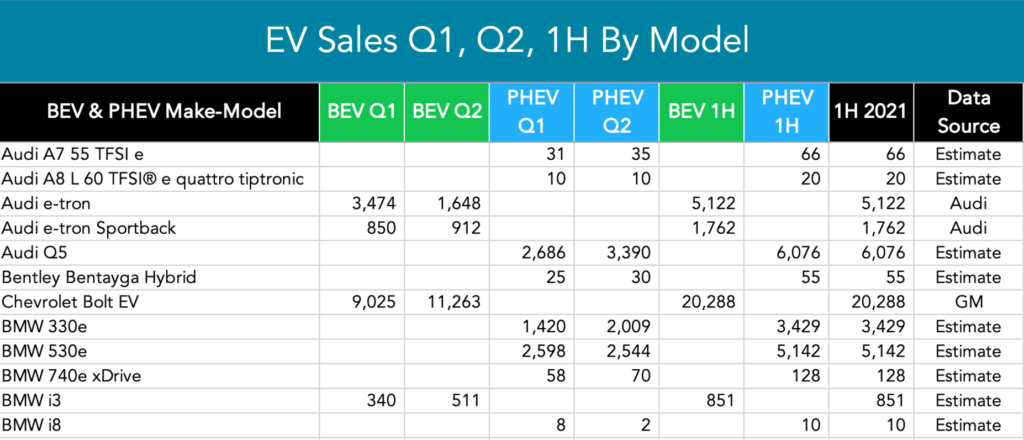
The EVAdoption US Electric Vehicle Sales Report: 1H 2021 is the first of what will be a quarterly sales report beginning with the next report covering Q3 2021. This inaugural report includes an Excel file and table of actual and estimated sales of 57 EVs for Q1 and Q2 2021 which is also categorized by BEV and PHEV. (See sample from the sales table below).

The 43-page PDF report includes the EV model tables plus 23 charts and graphs accompanied by brief analysis and observations to keep the report visual and easy to read and comprehend. Below is a list of all 24 tables and charts:
Section 1: Overall Sales Table By Models: Q1, Q2 & 1H
1.EV Sales Q1, Q2, 1H By Model
Section 2: Overall 1H Sales Trends
2.Q1, Q2 & 1H 2021 US EV Sales
3.Top 15-Selling BEV & PHEV Models 1H 2021
4.BEV Models By Percentage of Total 1H BEV Sales
5.Top 15 PHEV Models By Percentage of Total 1H PHEV Sales
6.Top 10 Best-Selling BEV Models: 1H 2021
7.Mean Sales Per BEV & PHEV Model 1H 2021
8.Median Sales Per BEV & PHEV Model 1H 2021
9.Number of BEV and PHEV Models: Q1, Q2 and 1H 2021
10.1H 2021 US Sales of Various PHEV Models
Section 3: Q2 Over Q1 Sales Change By Model
11.Overall EV Sales Increase/Decrease Q2 Over Q1
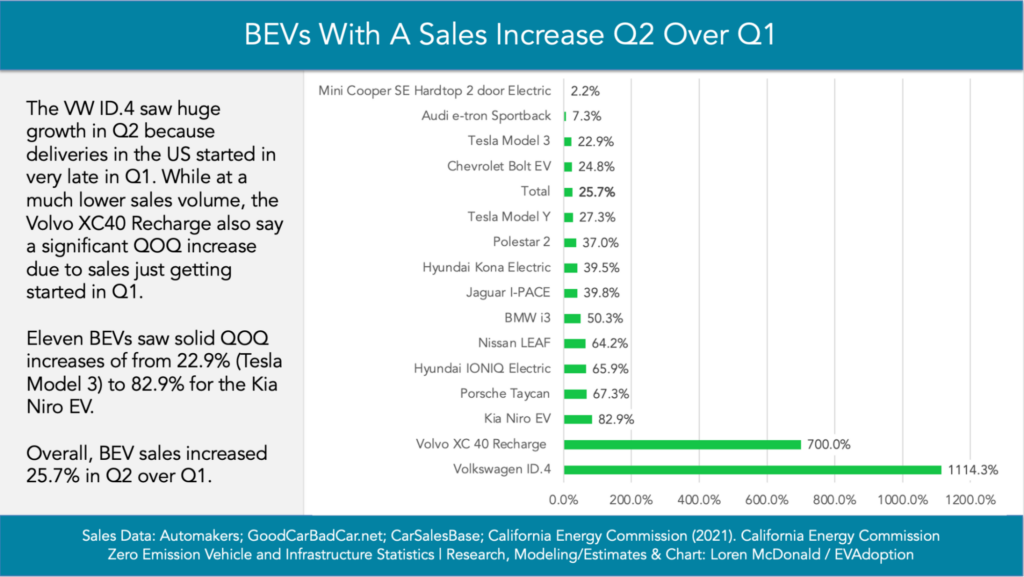
12.BEVs With A Sales Increase Q2 Over Q1
13.BEVs With A Sales Decrease Q2 Over Q1
14.Top 15 PHEVs With A Sales Increase Q2 Over Q1
15.Second 13 PHEVs With A Sales Increase Q2 Over Q1
16.PHEVs With Worst Sales Increase Q2 Over Q1
Section 4: EV Sales by Automaker & Country Assembled
17.Total Tesla Model Sales as a % of BEV & PHEV Sales
18.OEM EV (BEV & PHEV) Sales Share of Total 1H 2021 EV Sales
19.OEM EV (BEV & PHEV) Sales 1H 2021 EV Sales
20.OEM Average Sales Per EV Model: 1H 2021
21.Number of EV Models Available in the US Per OEM: 1H 2021
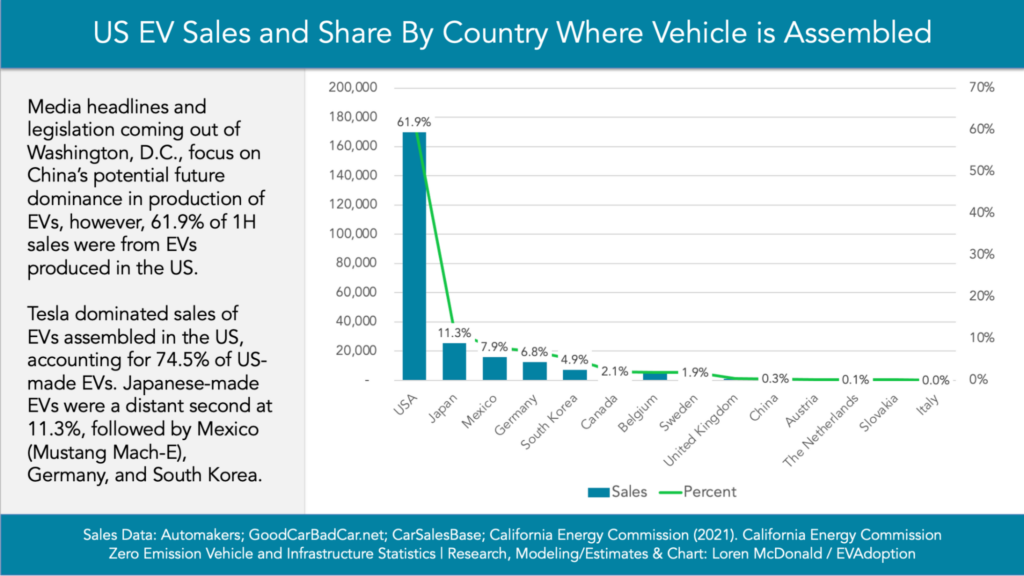
22.US EV Sales /Share By Country Where Vehicle is Assembled
Section 5: Overall Historical EV Sales
23.US Electric Vehicle Sales 2018 – 2021
24.1/4 of All EVs Sold To Date in the US Will Occur in 2021
In this sample chart below you see that the Volkswagen ID.4 and Volvo XC 40 Recharge had “off the chart” sales increases in Q2 over Q1 due to the simple fact that both vehicles really began arriving at dealers in small volumes in Q1. Overall, BEV sales increased 25.7% in Q2 over Q1. Thirteen of the 20 BEVs available had Q2 increases of more than 20% over Q1.

Another sample chart is of EV sales and share by the country where the electric vehicle was assembled. Not surprisingly due to Tesla dominating EV sales in the US and its four models being assembled in Fremont, CA — 61.9% of EVs sold in the 1H were assembled in the US.
Japan was a distant second with the Prius Prime and RAV4 Prime PHEVs from Toyota accounting for a majority of the sales. Mexico was in third place due to solid sales of the Ford Mustang Mach-E which is made in the Cuautitlán Assembly plant in Cuautitlán Izcalli, Mexico. In fourth is Germany based on several EVs from Audi, BMW, Mercedes-Benz, and Volkswagen. With new models coming later in 2021 from Hyundai and Kia, along with the German OEMs — we could see a shake up in the number 2-5 spots by then end of 2021.

The EVAdoption US Electric Vehicle Sales Report: 1H 2021 is now available for purchase for $395 (EVAdoption newsletter subscribers get 10% off at purchase). If you have questions on the report before purchasing, fill out our contact form and we’ll get your questions answered as quickly as possible.

 Announcing the acquisition of EVAdoption by Paren →
2 Responses