Note: This is the aggregated sales and not sales by brand or individual model.
Looking for recent electric vehicle sales (registration) numbers and sales share by US state? Did you know that:
Six states in 2022 had more EV (BEV + PHEV) sales than regular hybrid sales.
Three states/districts (California, Washington, and DC) had BEV sales share above 10%.
Only two regions (District of Columbia and Oregon) had greater than 3% PHEV sales share.
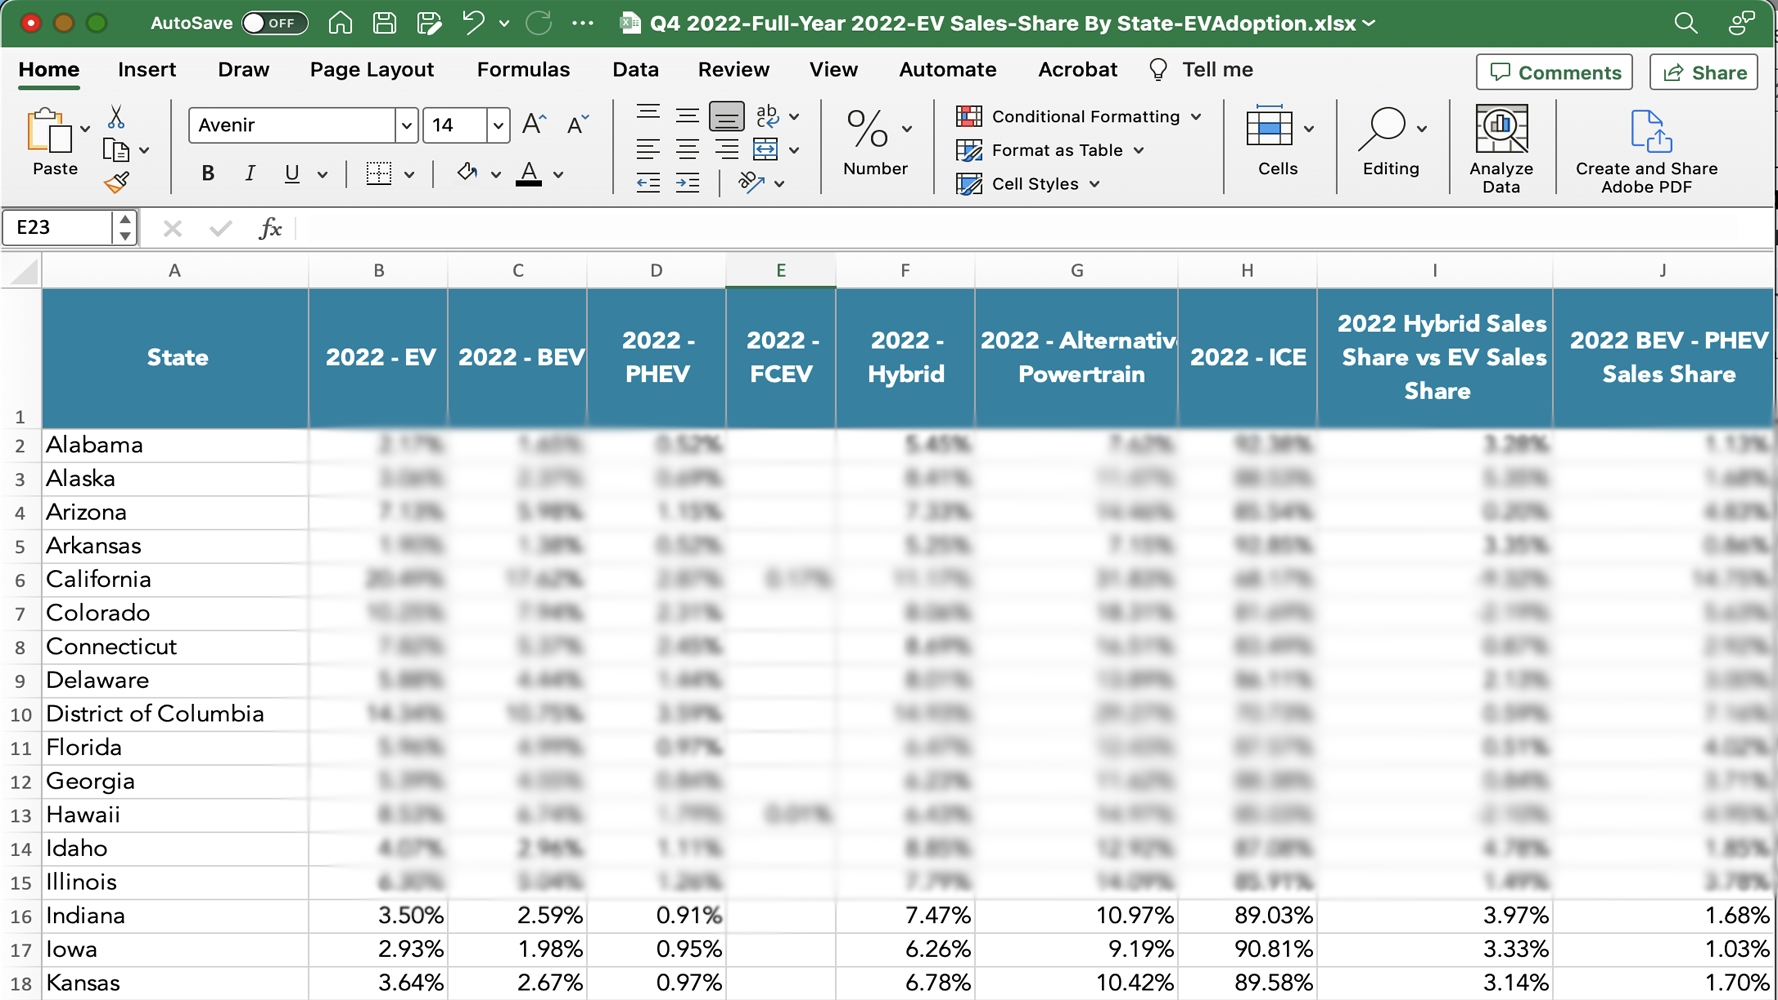
While California had a BEV sales share of 17.6%, three states have a BEV sales share of less than 1% in 2022.
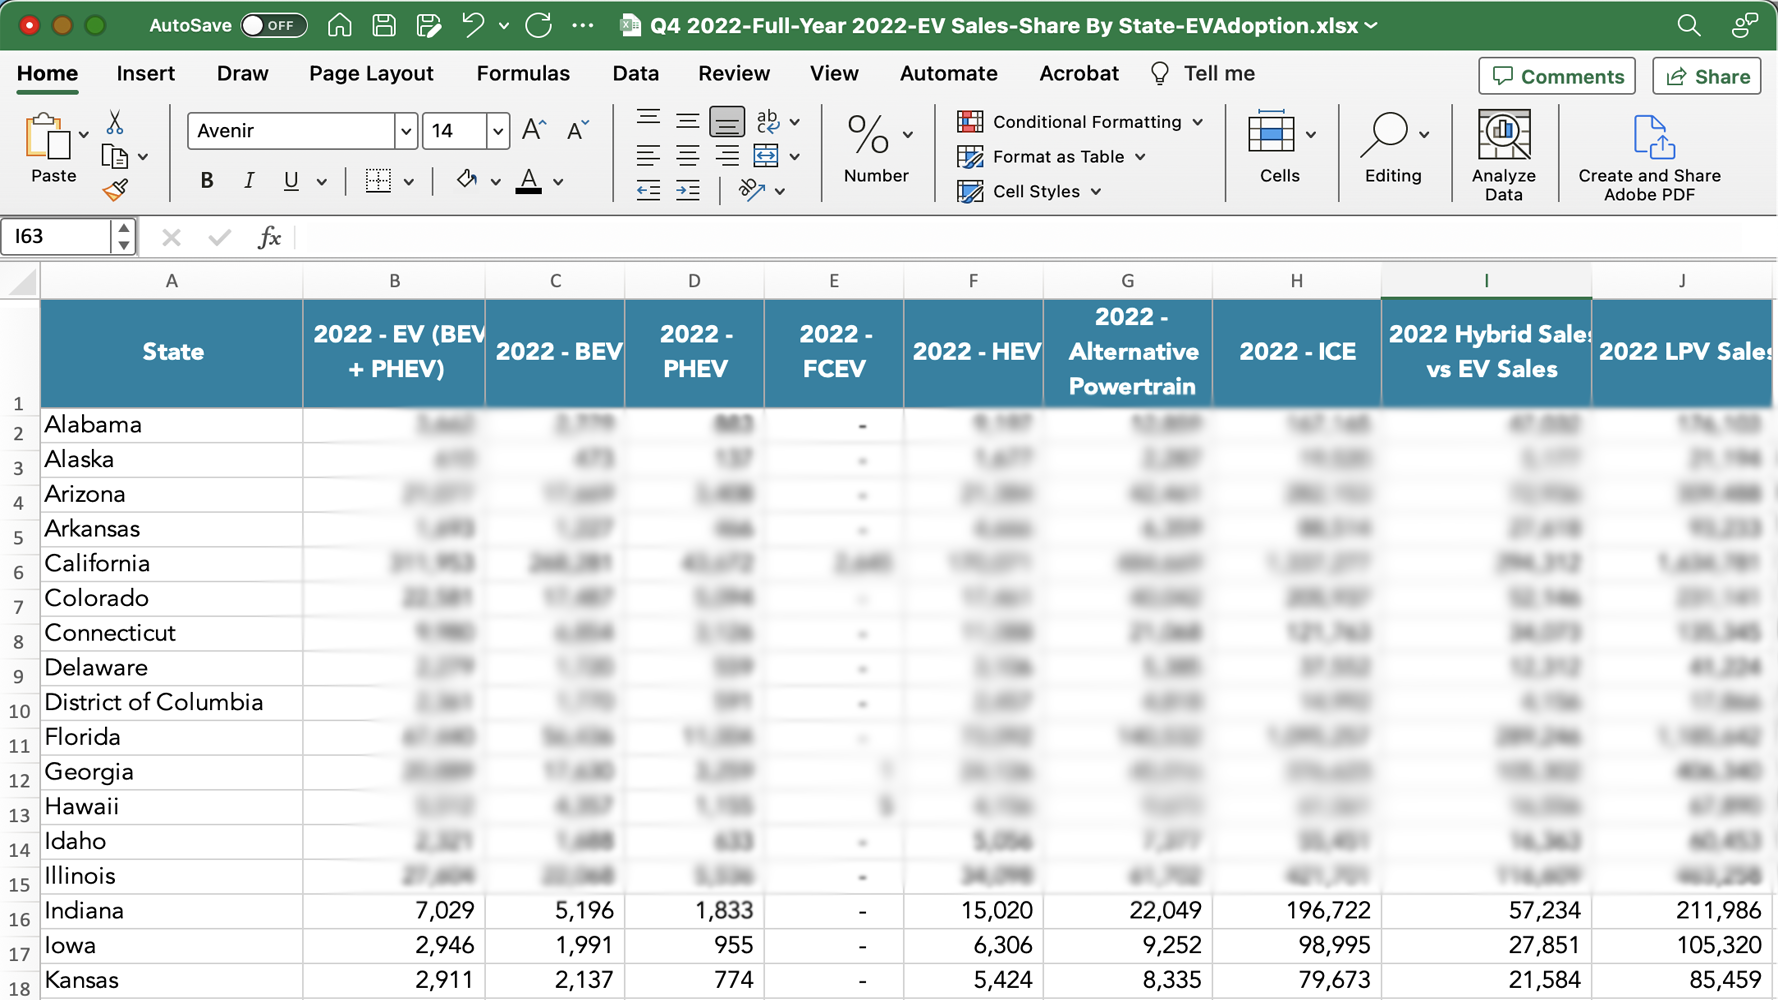
Six states accounted for 49% of total US BEV sales in 2022.
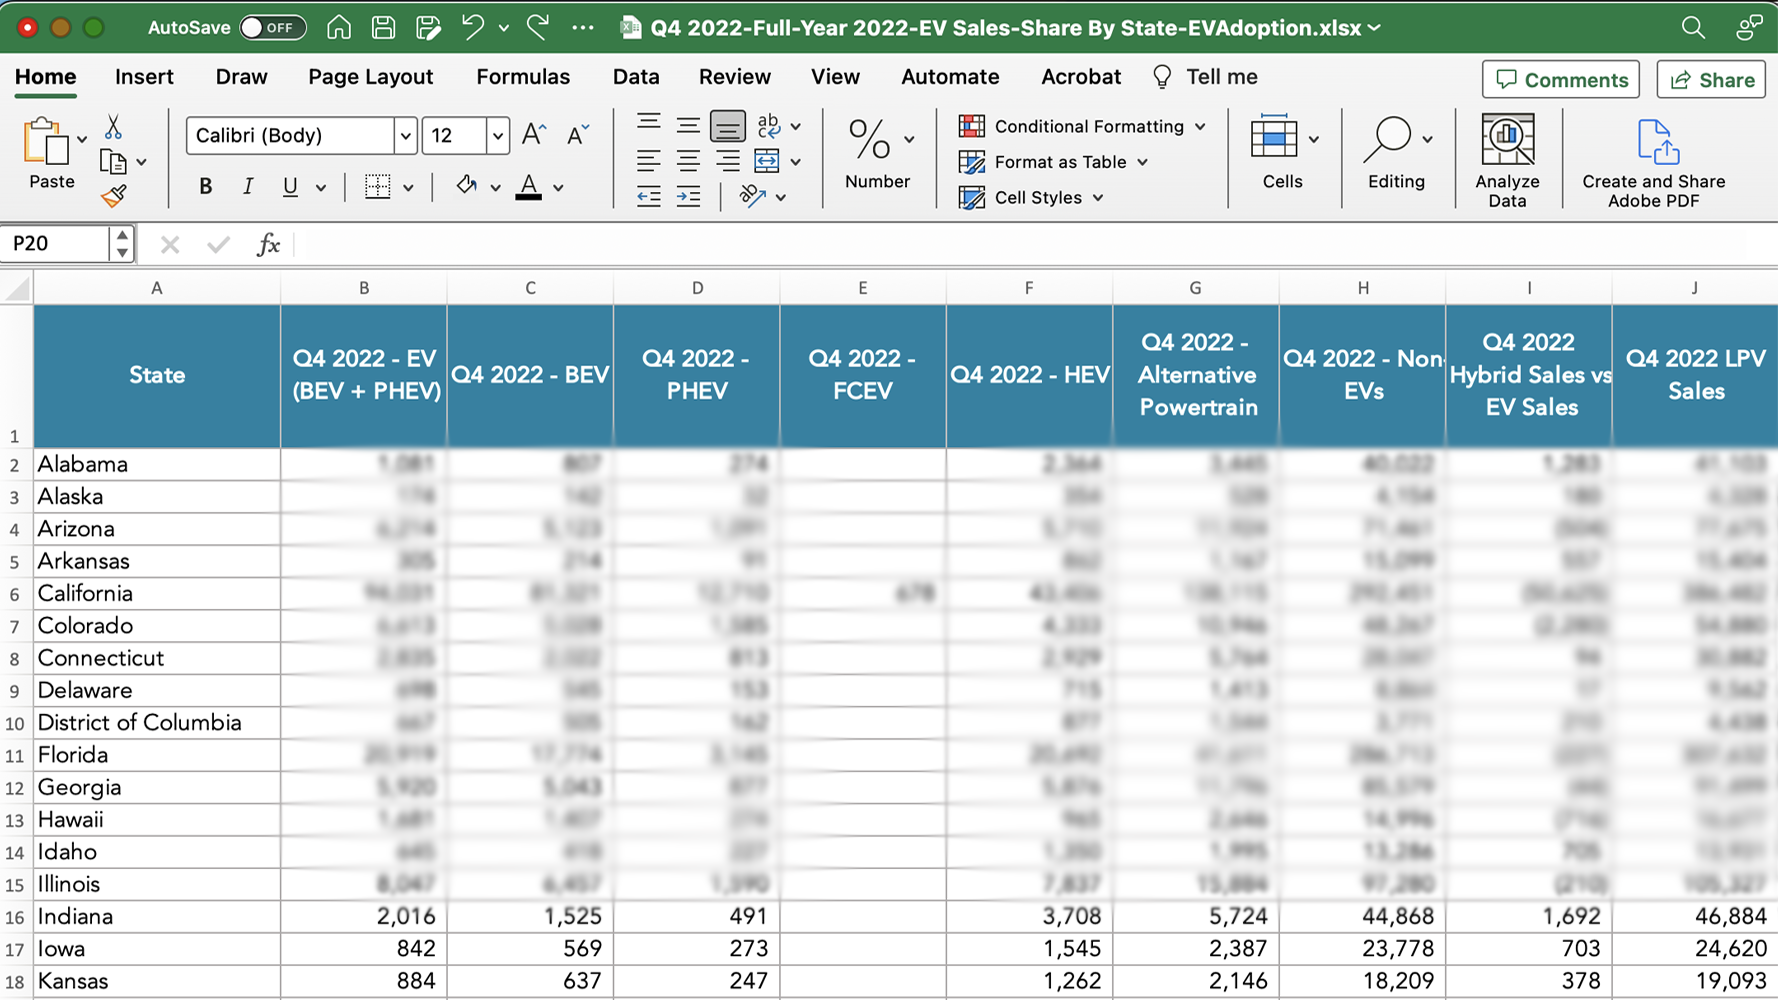
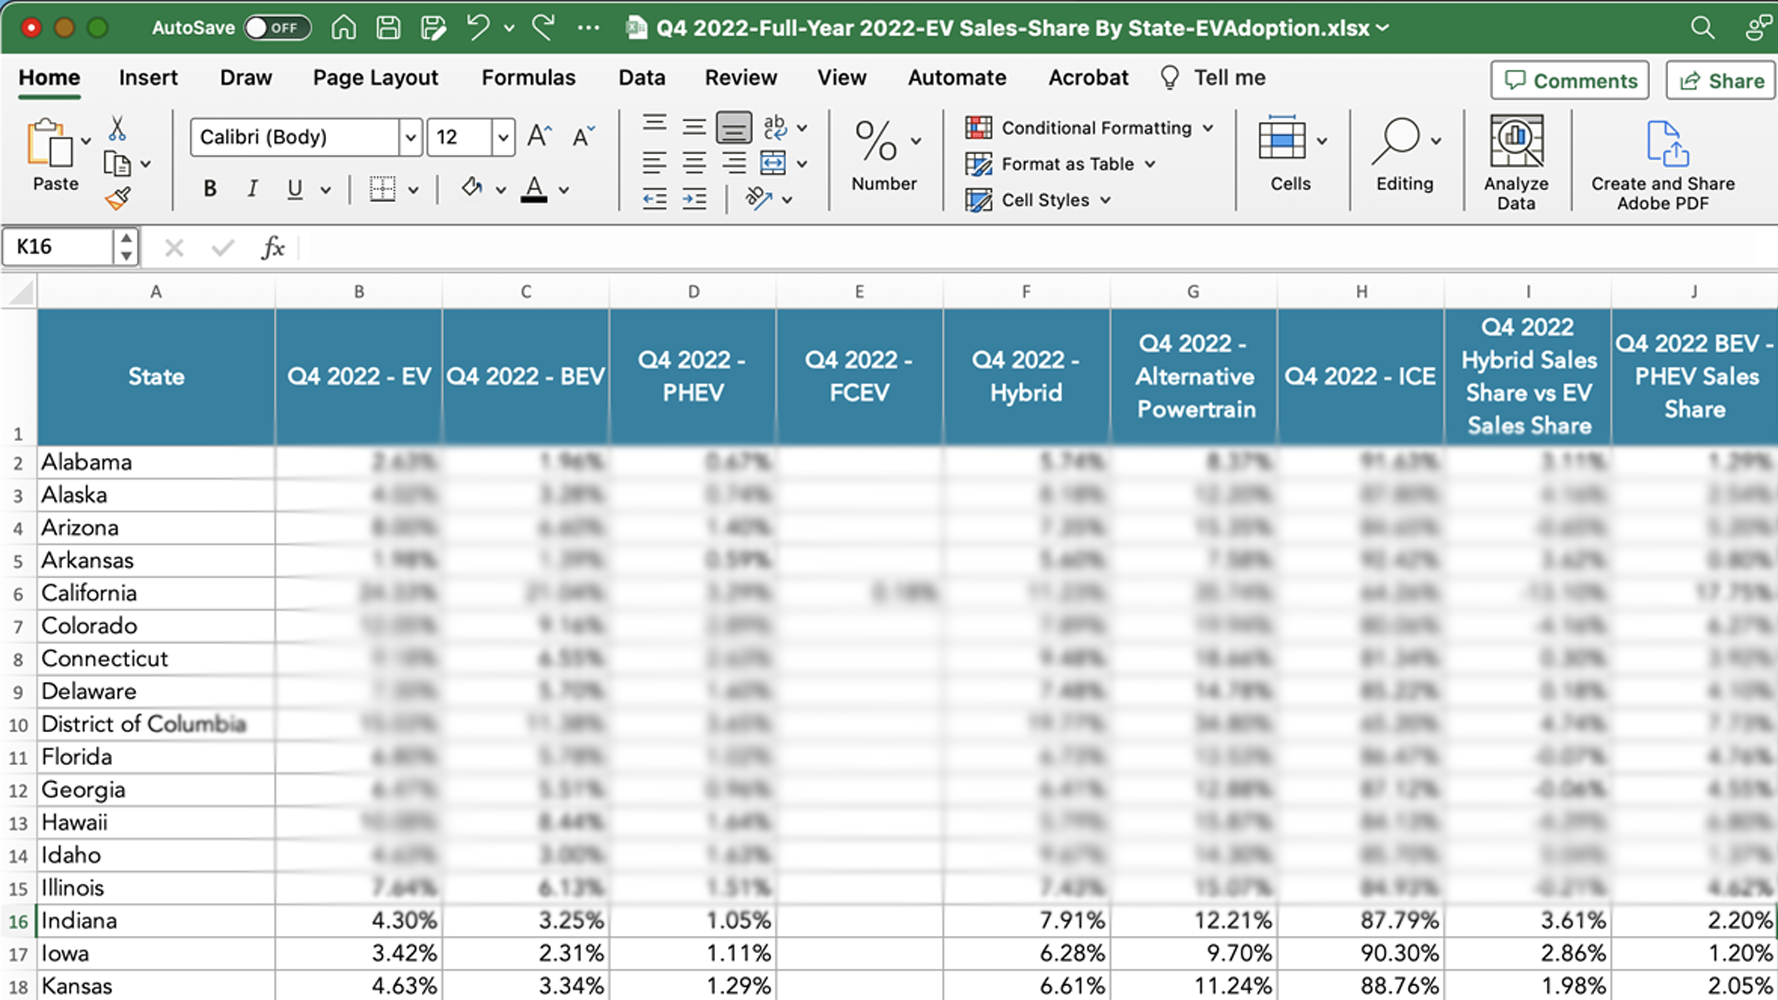
Uncover these and other trends in this Excel spreadsheet where you will find 2022 vehicle sales and share by type of powertrain for each US state and the District of Columbia for:
Q1 2022
Q2 2022
Q3 2022
Q4 2022
Full Year 2022
The file includes sales (registrations) and sales share for the following powertrain types and combinations:
EV (BEV + PHEV)
BEV (battery electric vehicle)
PHEV (plug-in hybrid)
FCEV (fuel cell)
HEV (regular, non-plug in hybrid)
Alternative Powertrain (BEV + PHEV + FCEV + HEV)
Hybrid vs EV – calculation based on the net difference between hybrids and EVs (BEV + PHEV)
ICE* (internal combustion engine, not including regular hybrids or PHEVs) – *estimate based on subtracting EV (BEV + PHEV) sales from total LPV sales.
LPV* (light passenger vehicle) – *estimate based on dividing EV sales by EV sales share
The Excel spreadsheet also includes definitions of each column of data
Have a question on the report before you buy, send us your question via our Contact form
© 2024 EVAdoption, LLC | All Rights Reserved.