Note: This is the aggregated sales and not sales by brand or individual model.
Looking for recent electric vehicle sales (registration) numbers and sales share by Canadian province? Did you know that:
Uncover these and other trends in this Excel spreadsheet where you will find Q3 2021-Q3 2022 sales and share for battery electric vehicles (BEVs) for Canada overall and the following Canadian provinces:
Note: The excel file does NOT contain data for these provinces/territories: Alberta, Newfoundland & Labrador, Northwest Territories, Nova Scotia, Nunavut, and Yukon.
The file includes sales (registrations) and sales share for BEVs for the provinces and all powertrain types of Canada overall.
Excel Sheets Included:
In addition to the Excel file of the raw EV sales data, EVAdoption has produced a PDF report specifically on Canadian sales and sales share of battery electric vehicles (BEVs). This 16-page report includes nine charts and tables on BEV sales and sales share for Q3 2022, Q1-Q3 2022, and Q3 2021 to Q3 2022.
The report has two sections: Canada Overall and Canada By Province. The US Overall section has four charts, and the Canada By Province section has five charts and tables that show how different provinces rank comparatively for BEV sales and sales share.
Q3 2022 vs. Q2 2022 Sales: All Powertrain & Fuel Types
BEV Sales Showing Steady Growth Relative to ICE Vehicles
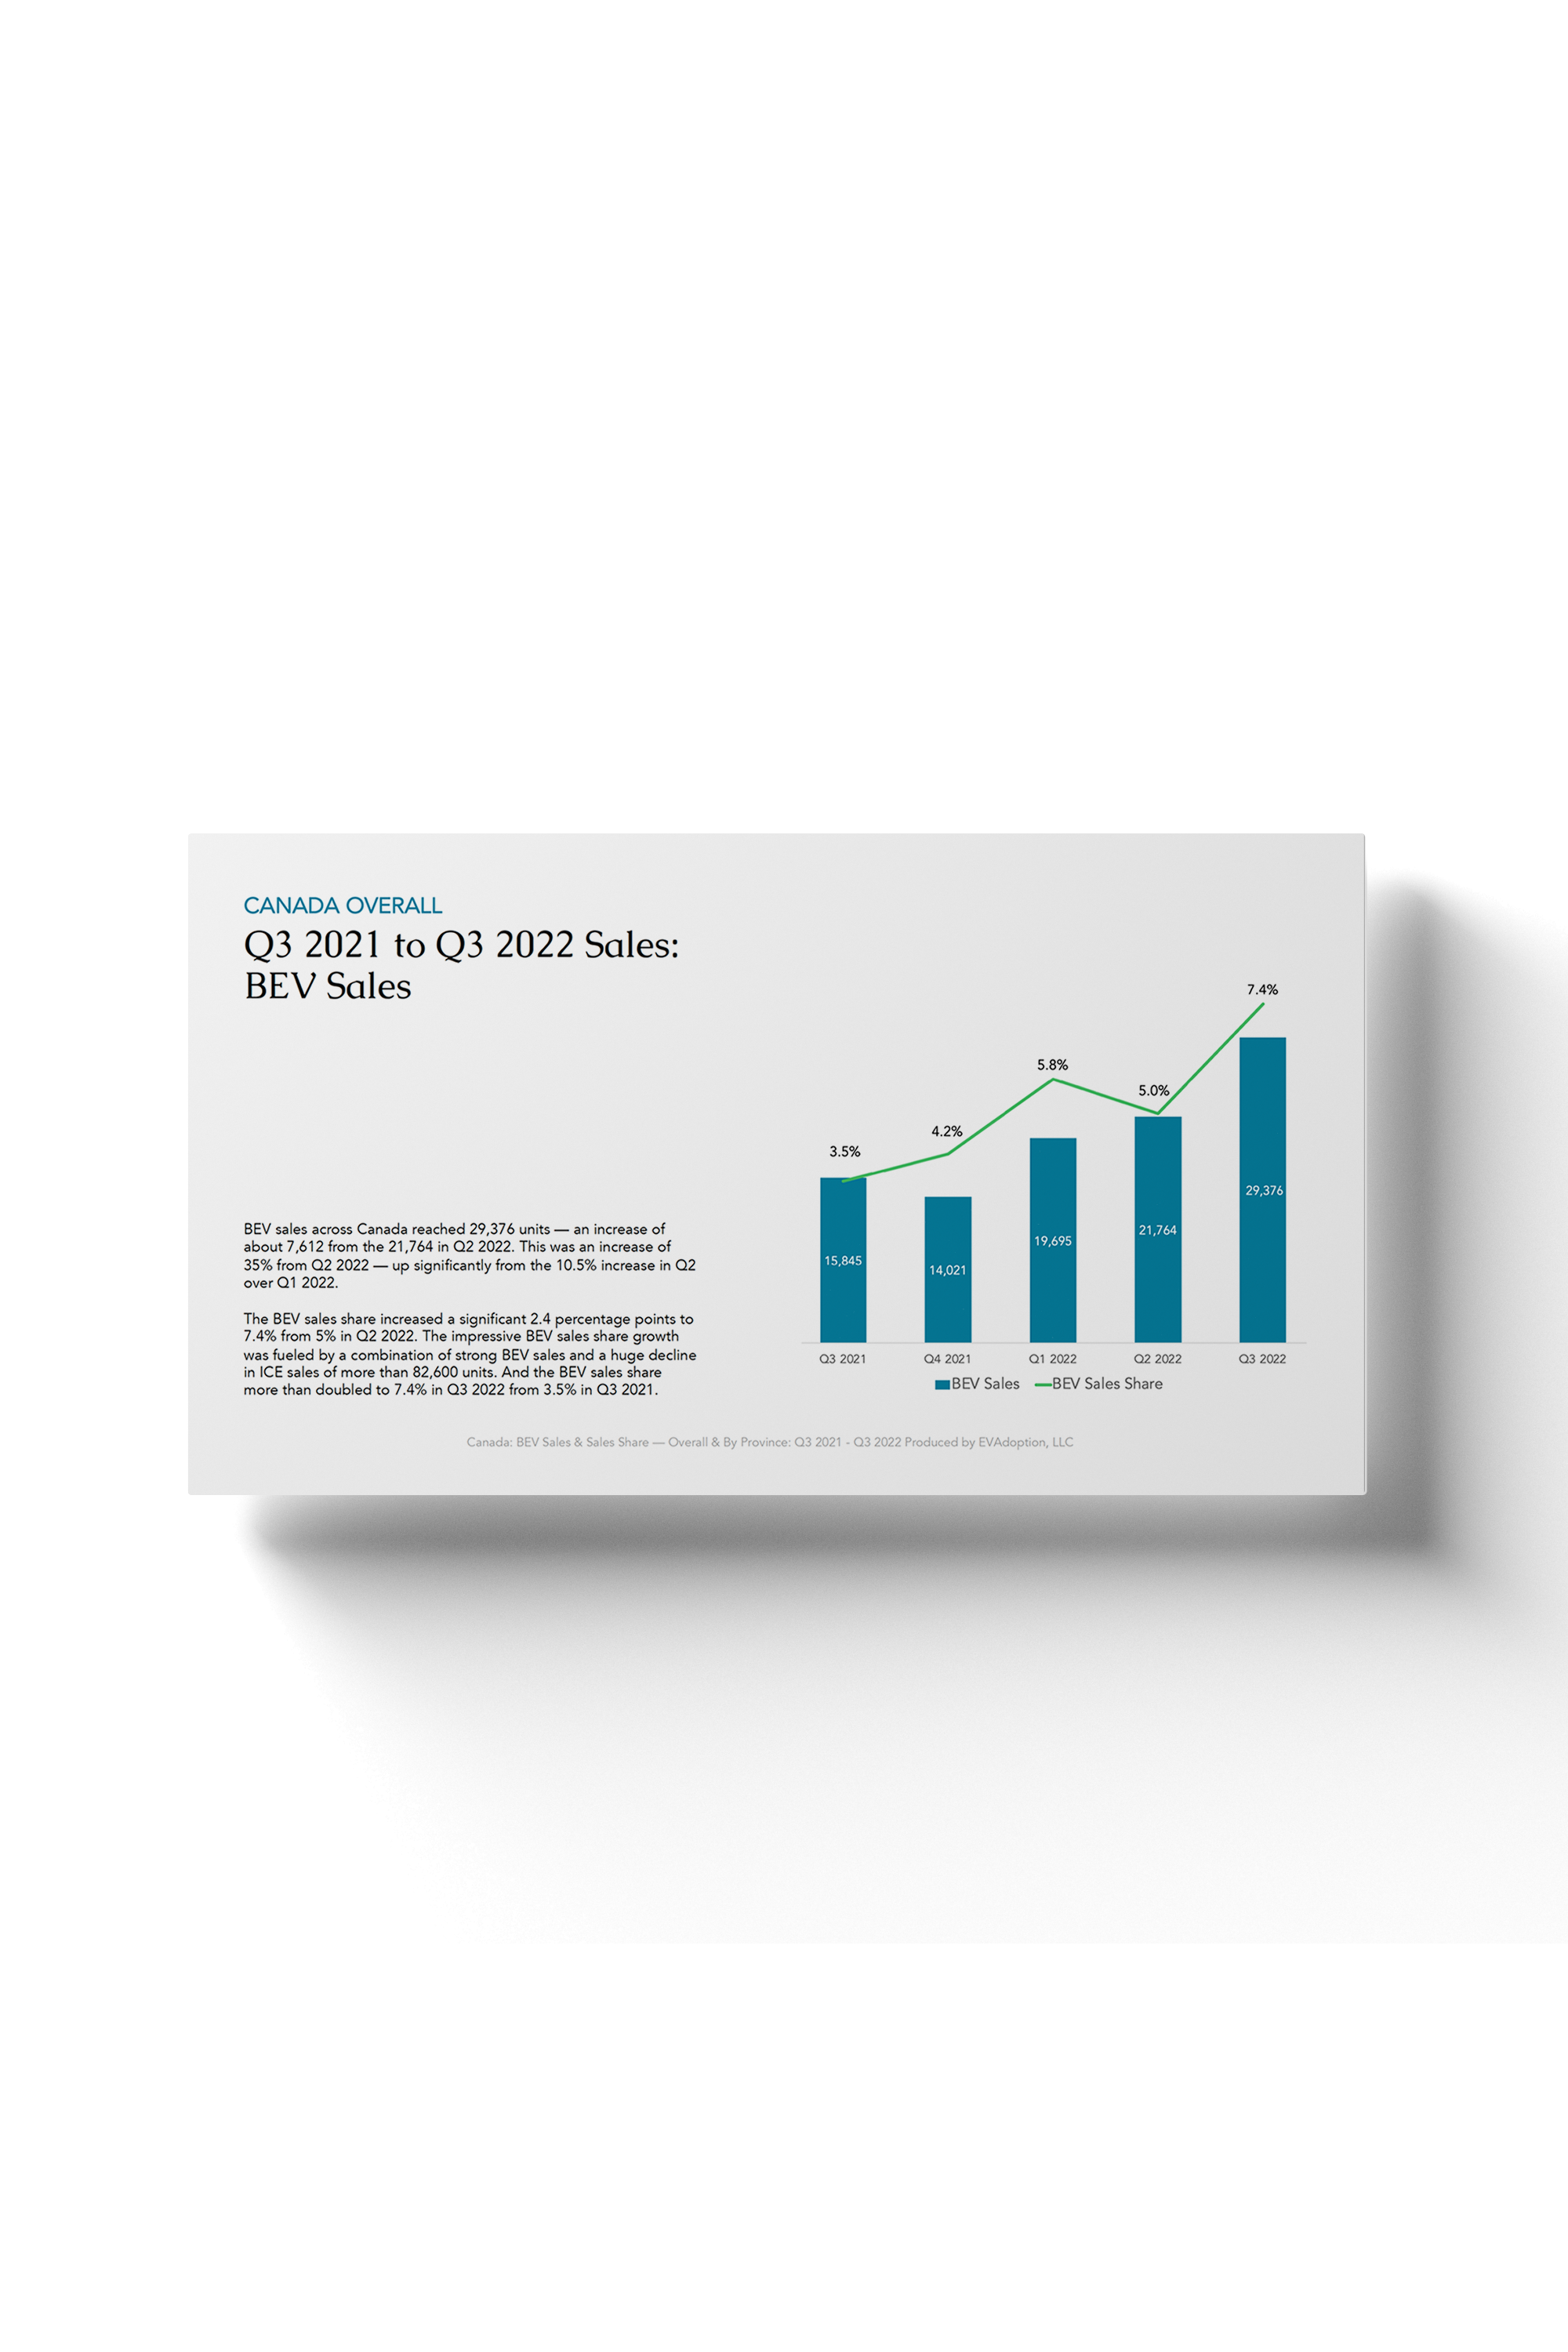
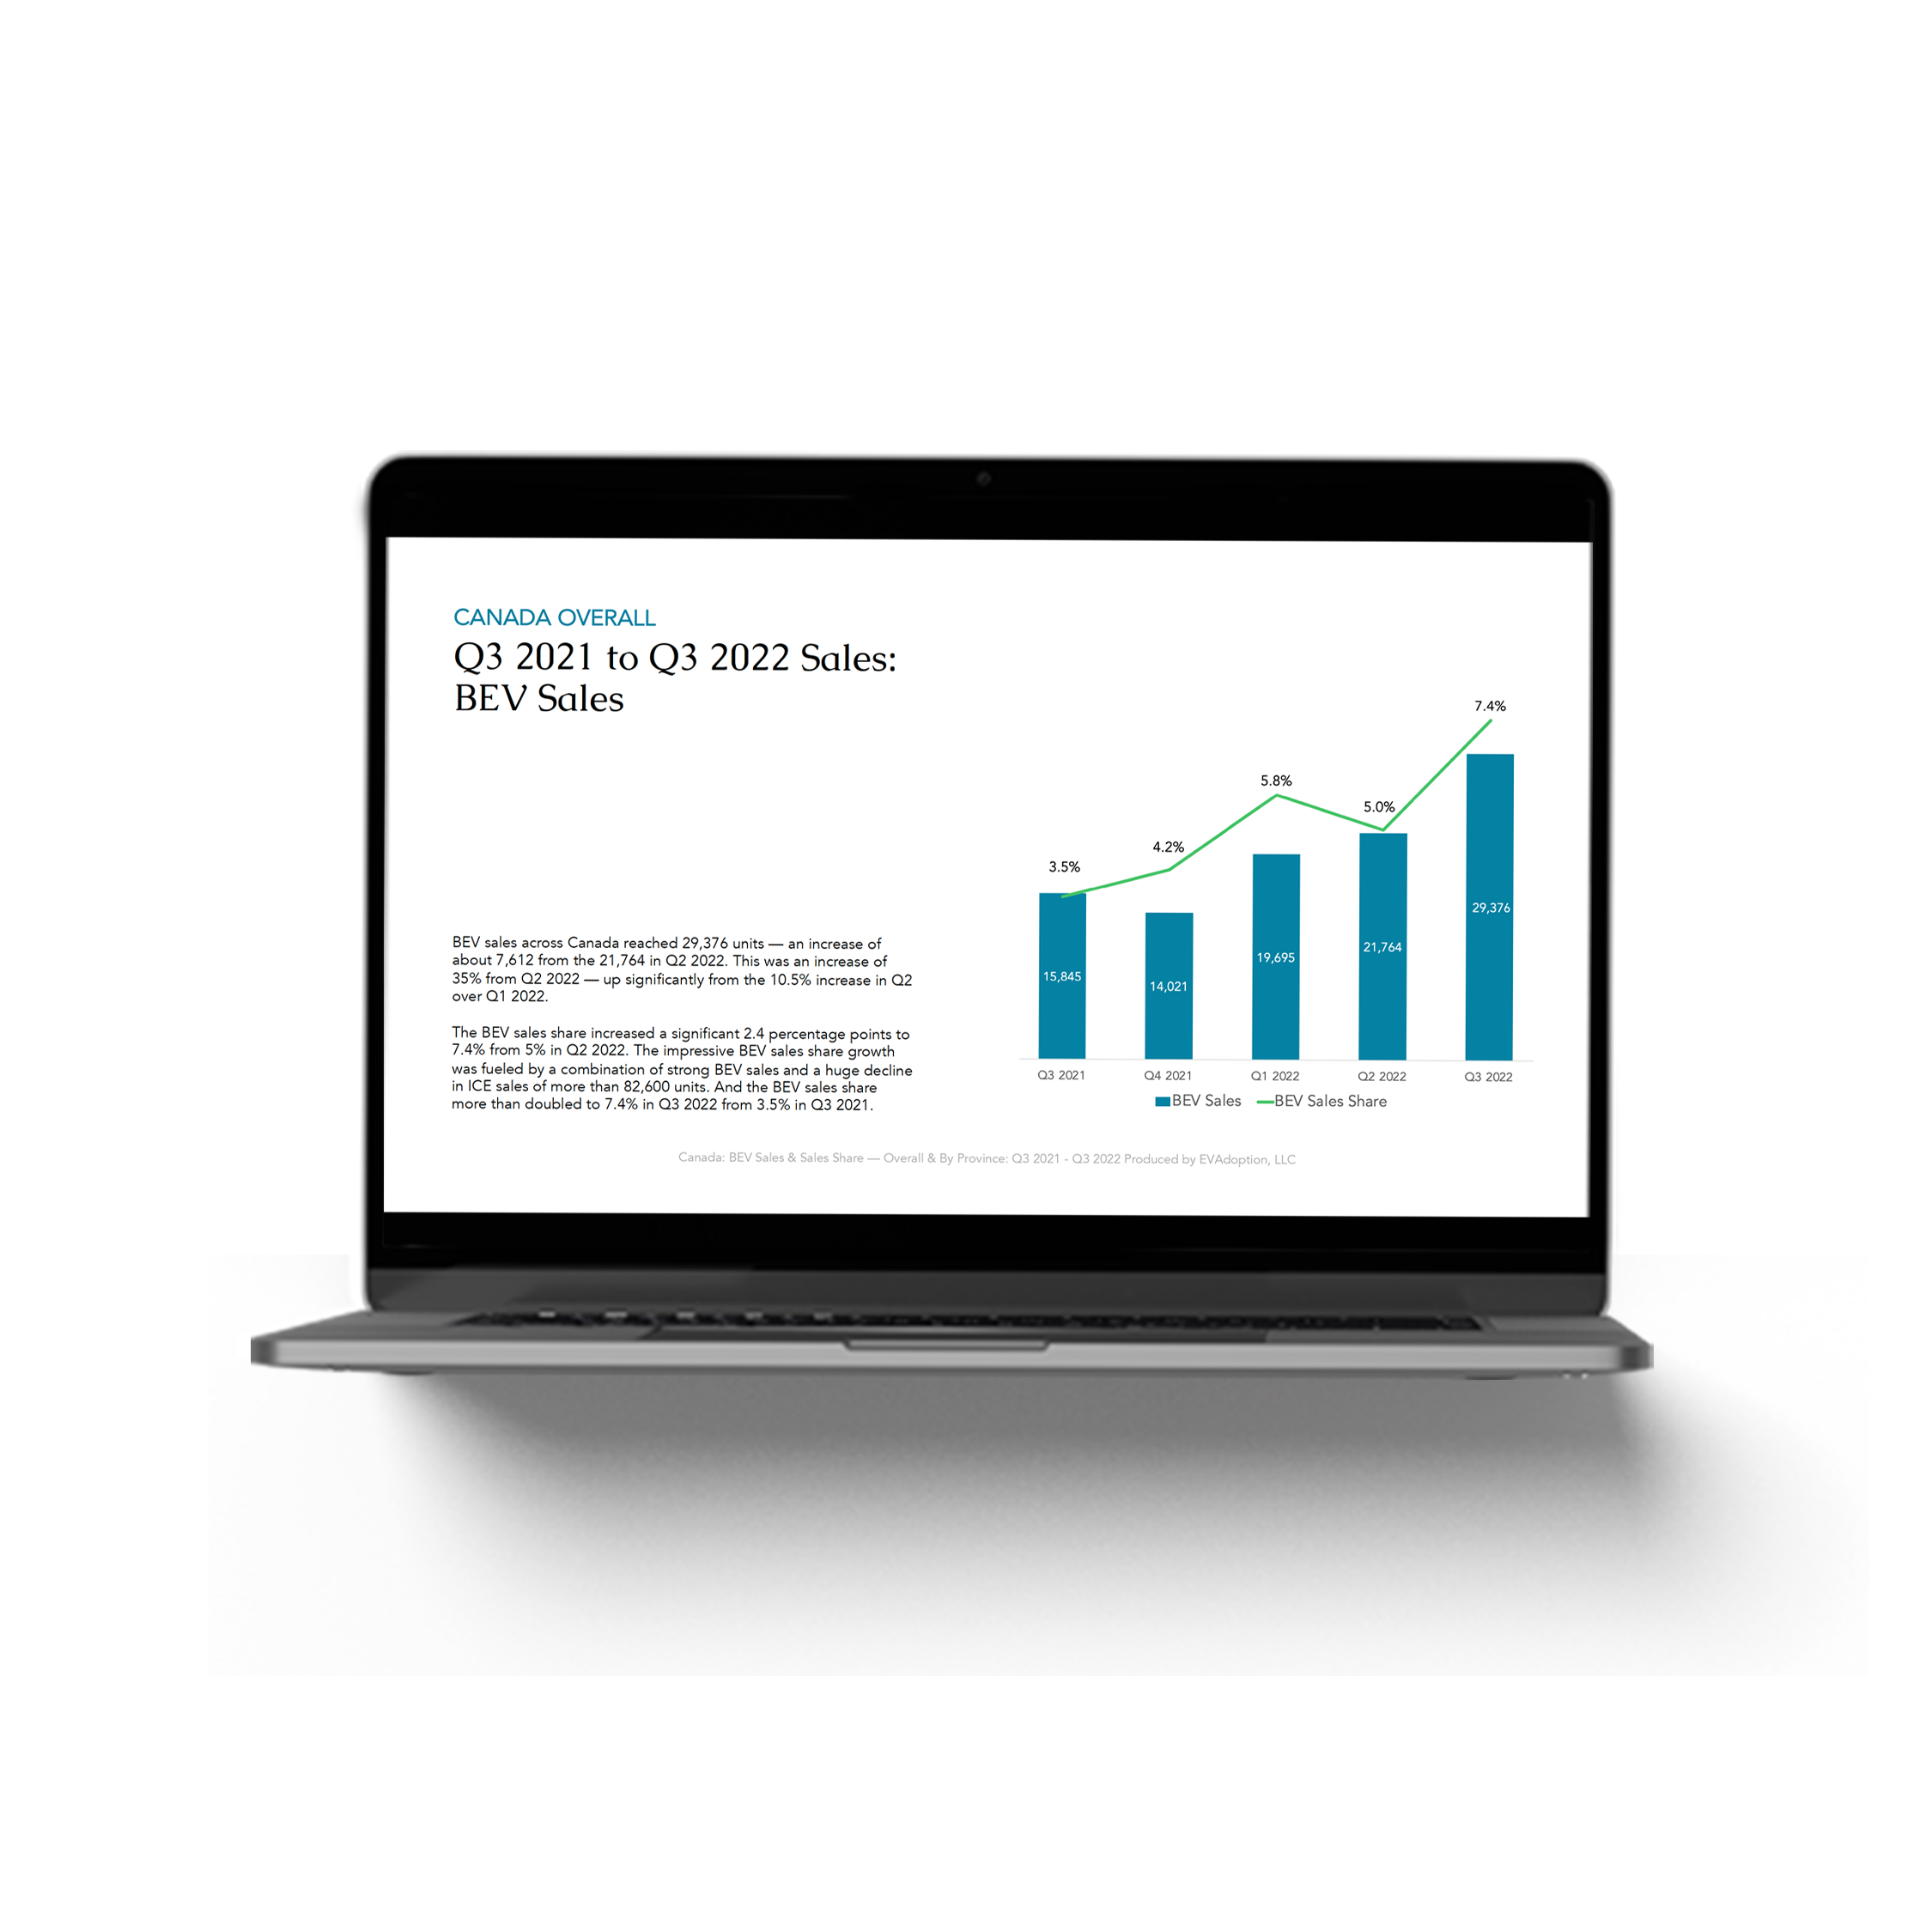
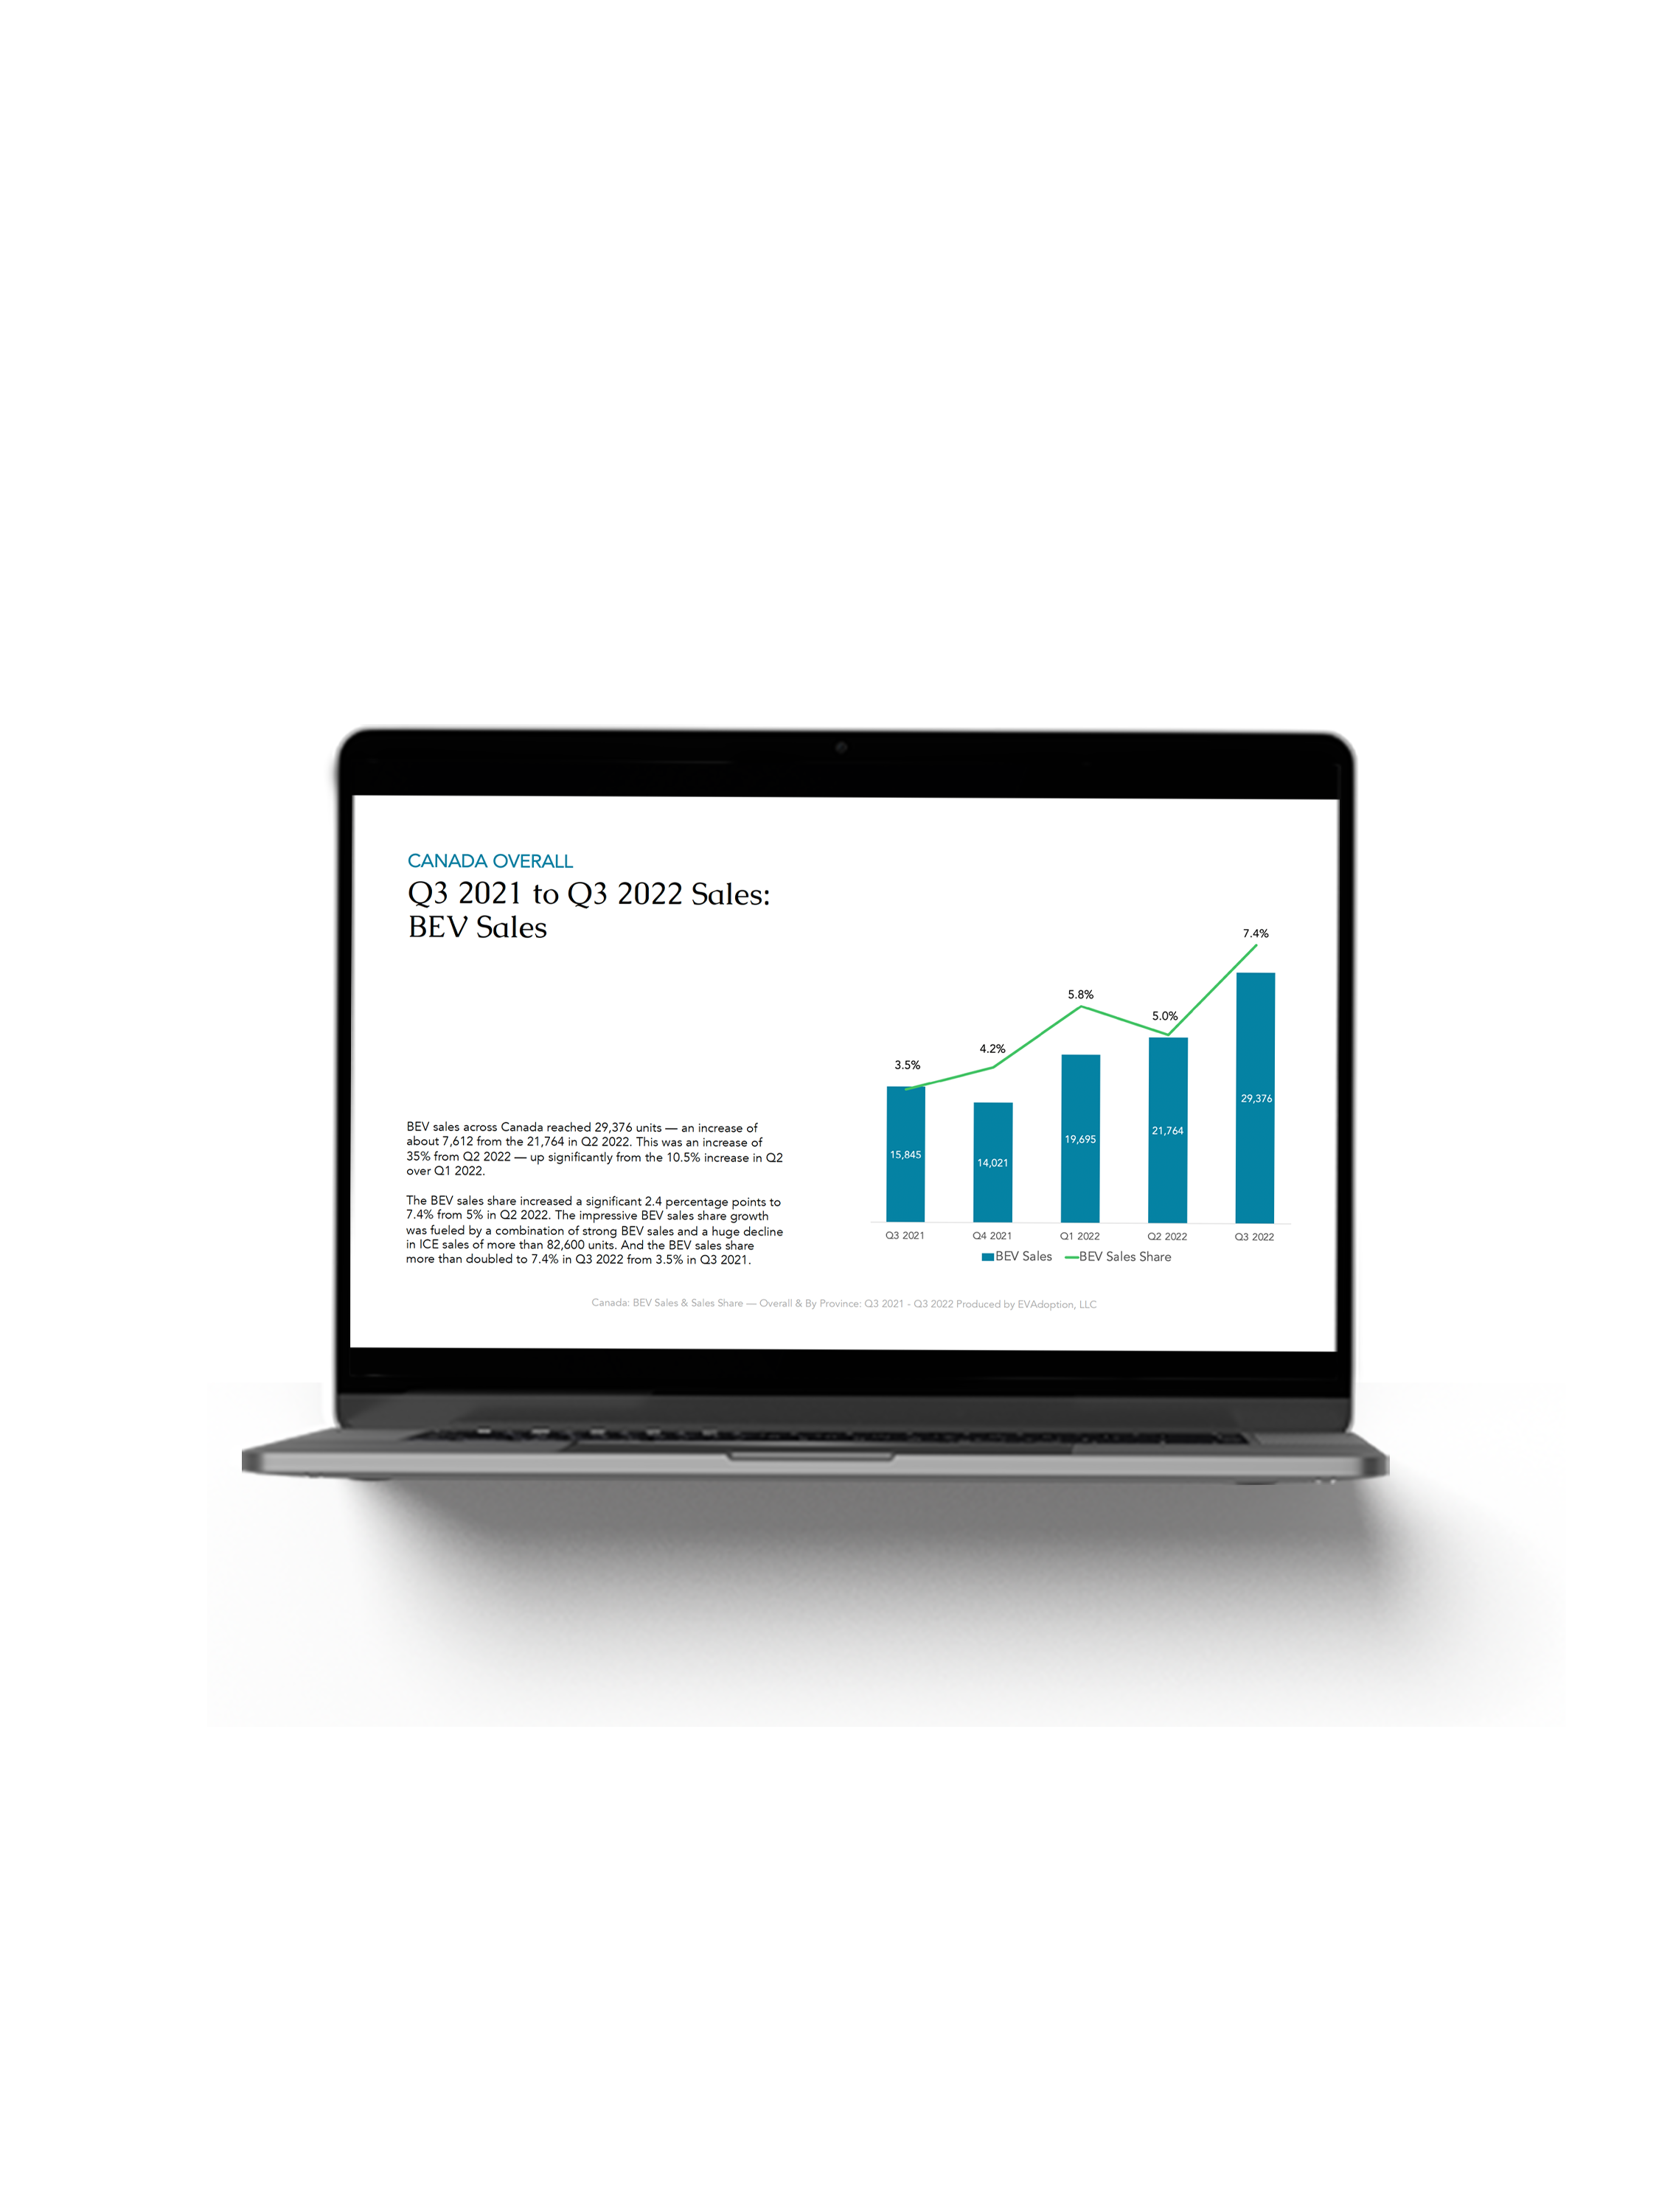
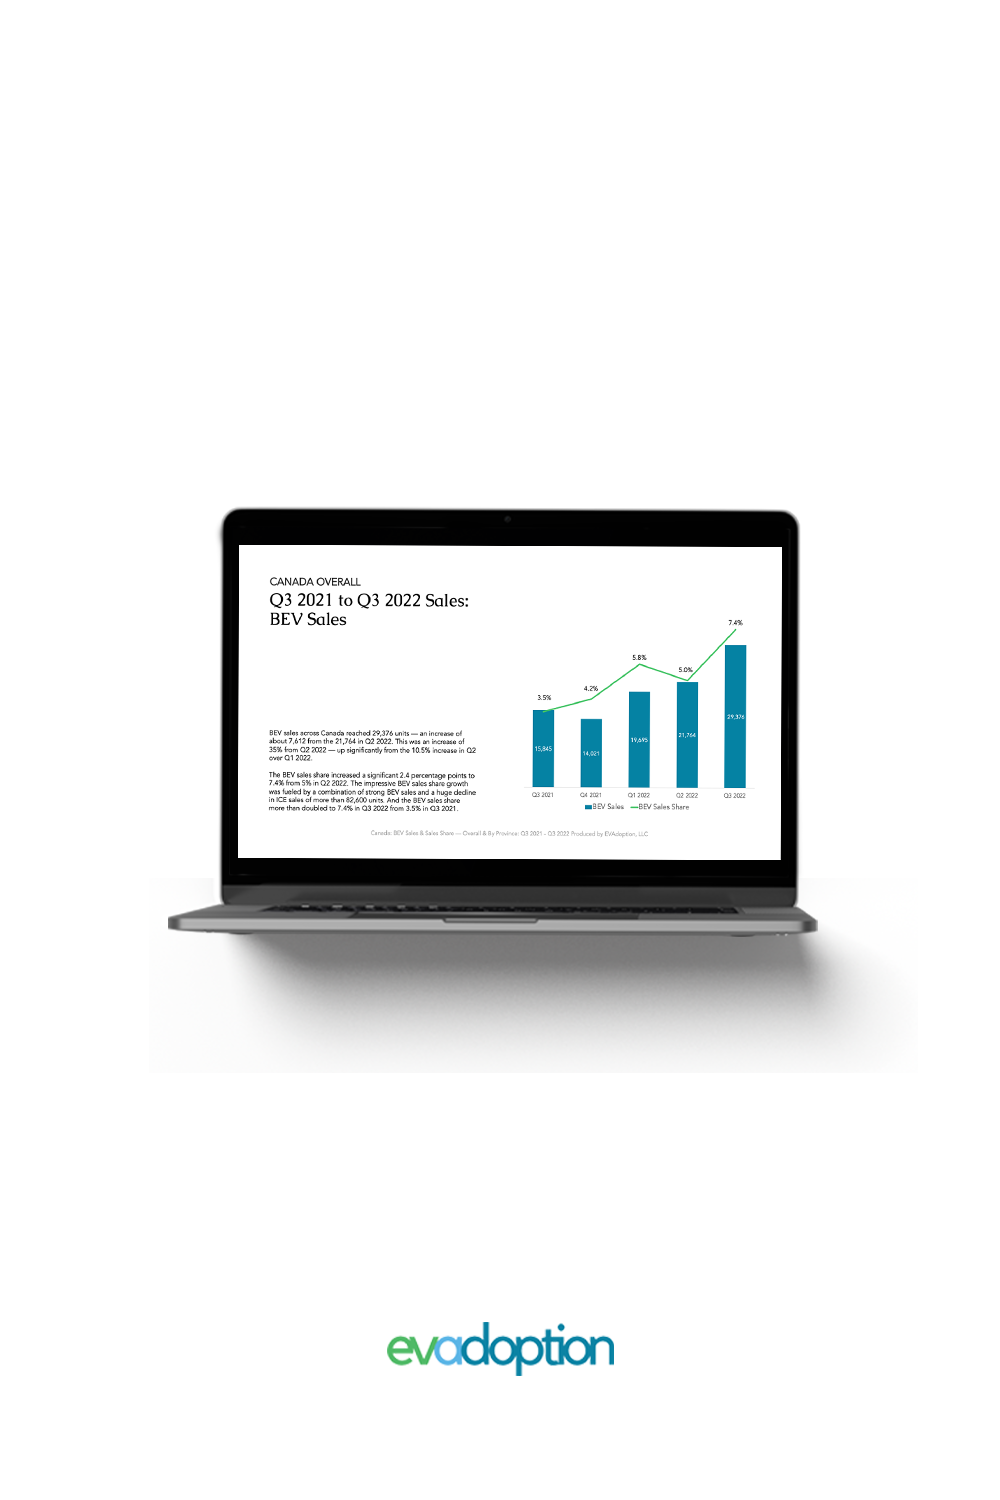
Q3 2021 to Q3 2022 Sales: BEV Sales
Q3 2021 to Q3 2022: QoQ Sales Growth Change
Canada by Province:
Q3 2021 to Q3 2022: BEV Sales
Q3 2021 to Q3 2022: BEV Sales Share
Q3 vs. Q2 2022 BEV Sales Change
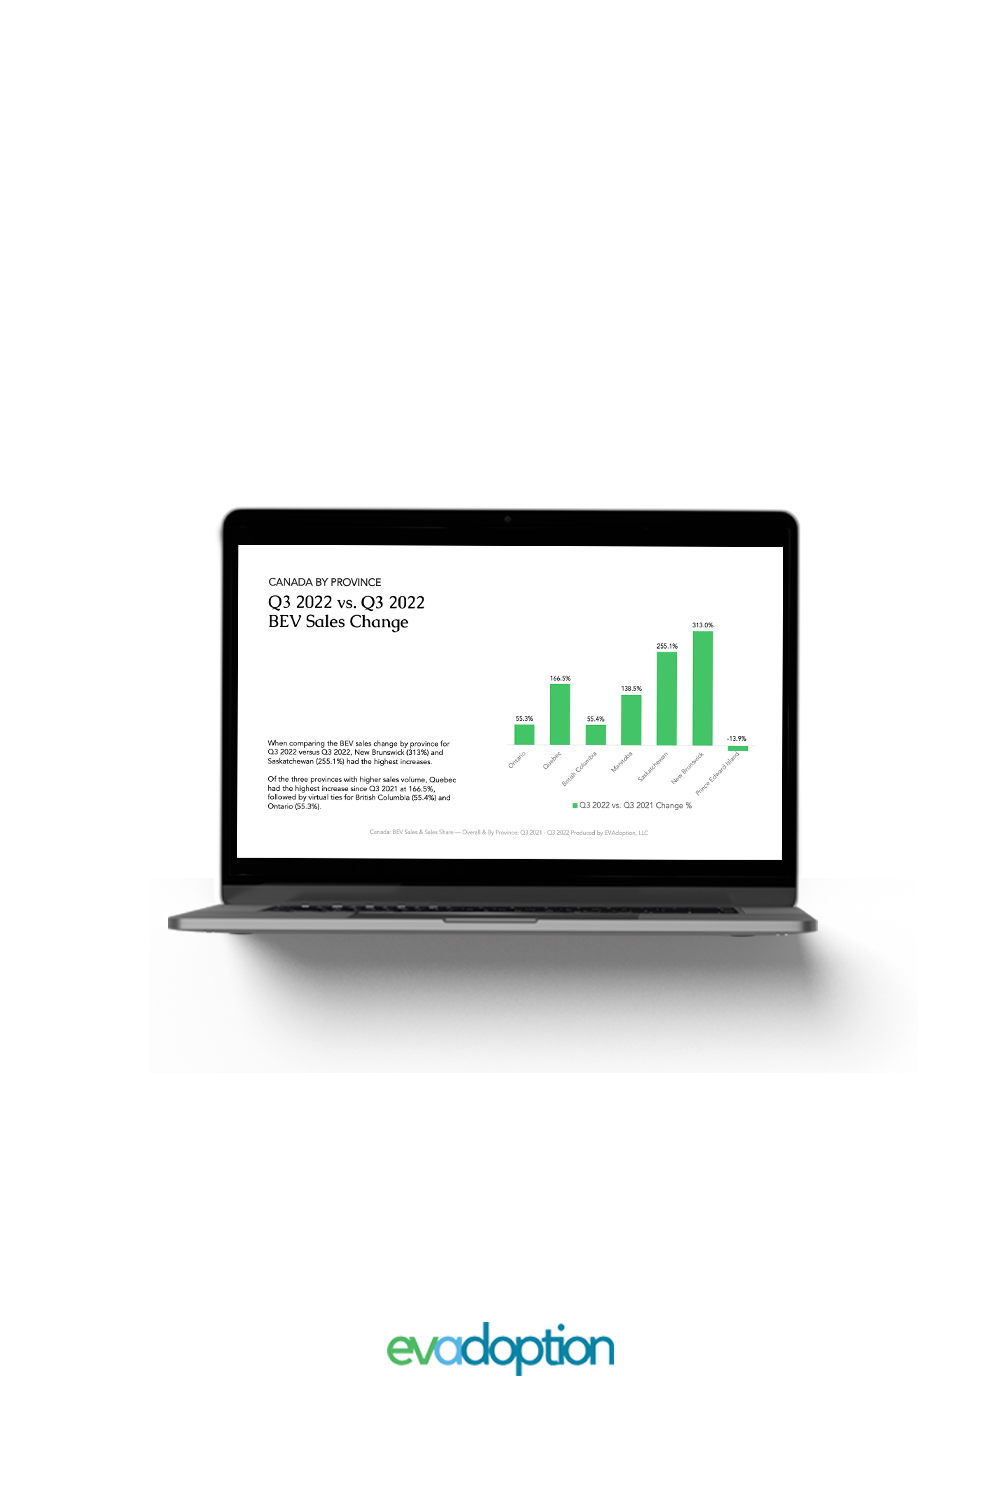
Q3 2022 vs. Q3 2022 BEV Sales Change
Have a question on the report before you buy, send us your question via our Contact form

Overall & by Province: Q3 2021 - Q3 2022
$425
Overall & by Province: Q3 2021 - Q3 2022
$425
Note: This is the aggregated sales and not sales by brand or individual model.
Looking for recent electric vehicle sales (registration) numbers and sales share by Canadian province? Did you know that:
© 2024 EVAdoption, LLC | All Rights Reserved.