Announcing the acquisition of EVAdoption by Paren →
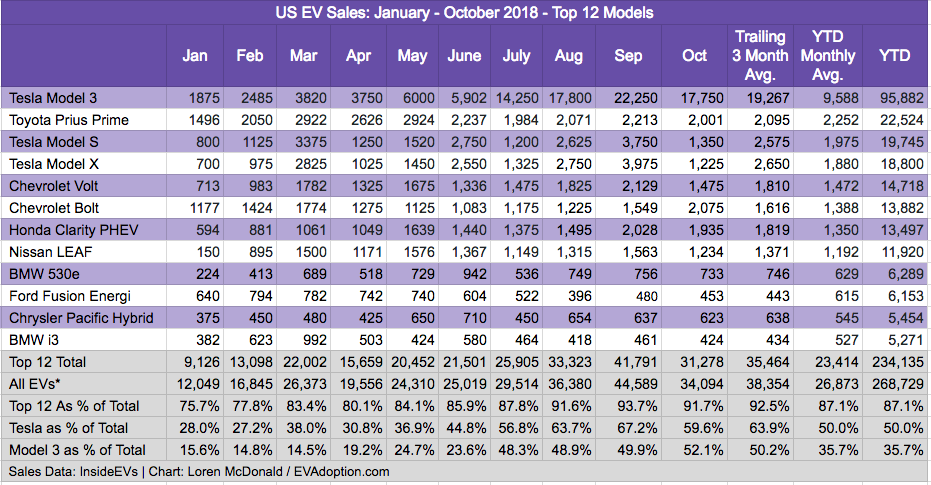
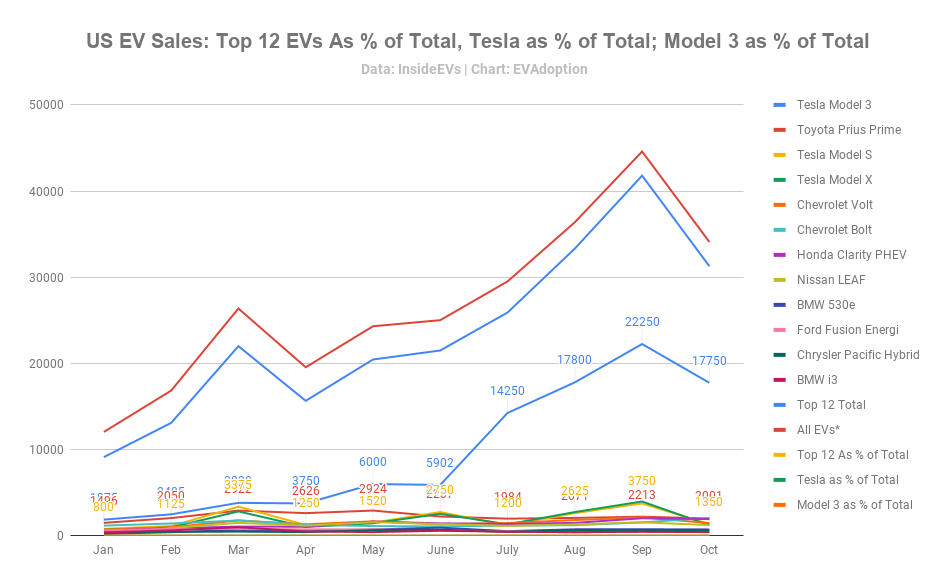
Using data from the InsideEV Monthly Plug-in Sales Scorecard, each month we will update the ranking of the top-12 selling electric vehicles (EVs) in the US, and provide our observations of trends in a related blog post.
Who has sold the most EVs (BEV + PHEV) since 2010? Below is a chart with sales percentage for EVs by automakers through October 2018:x
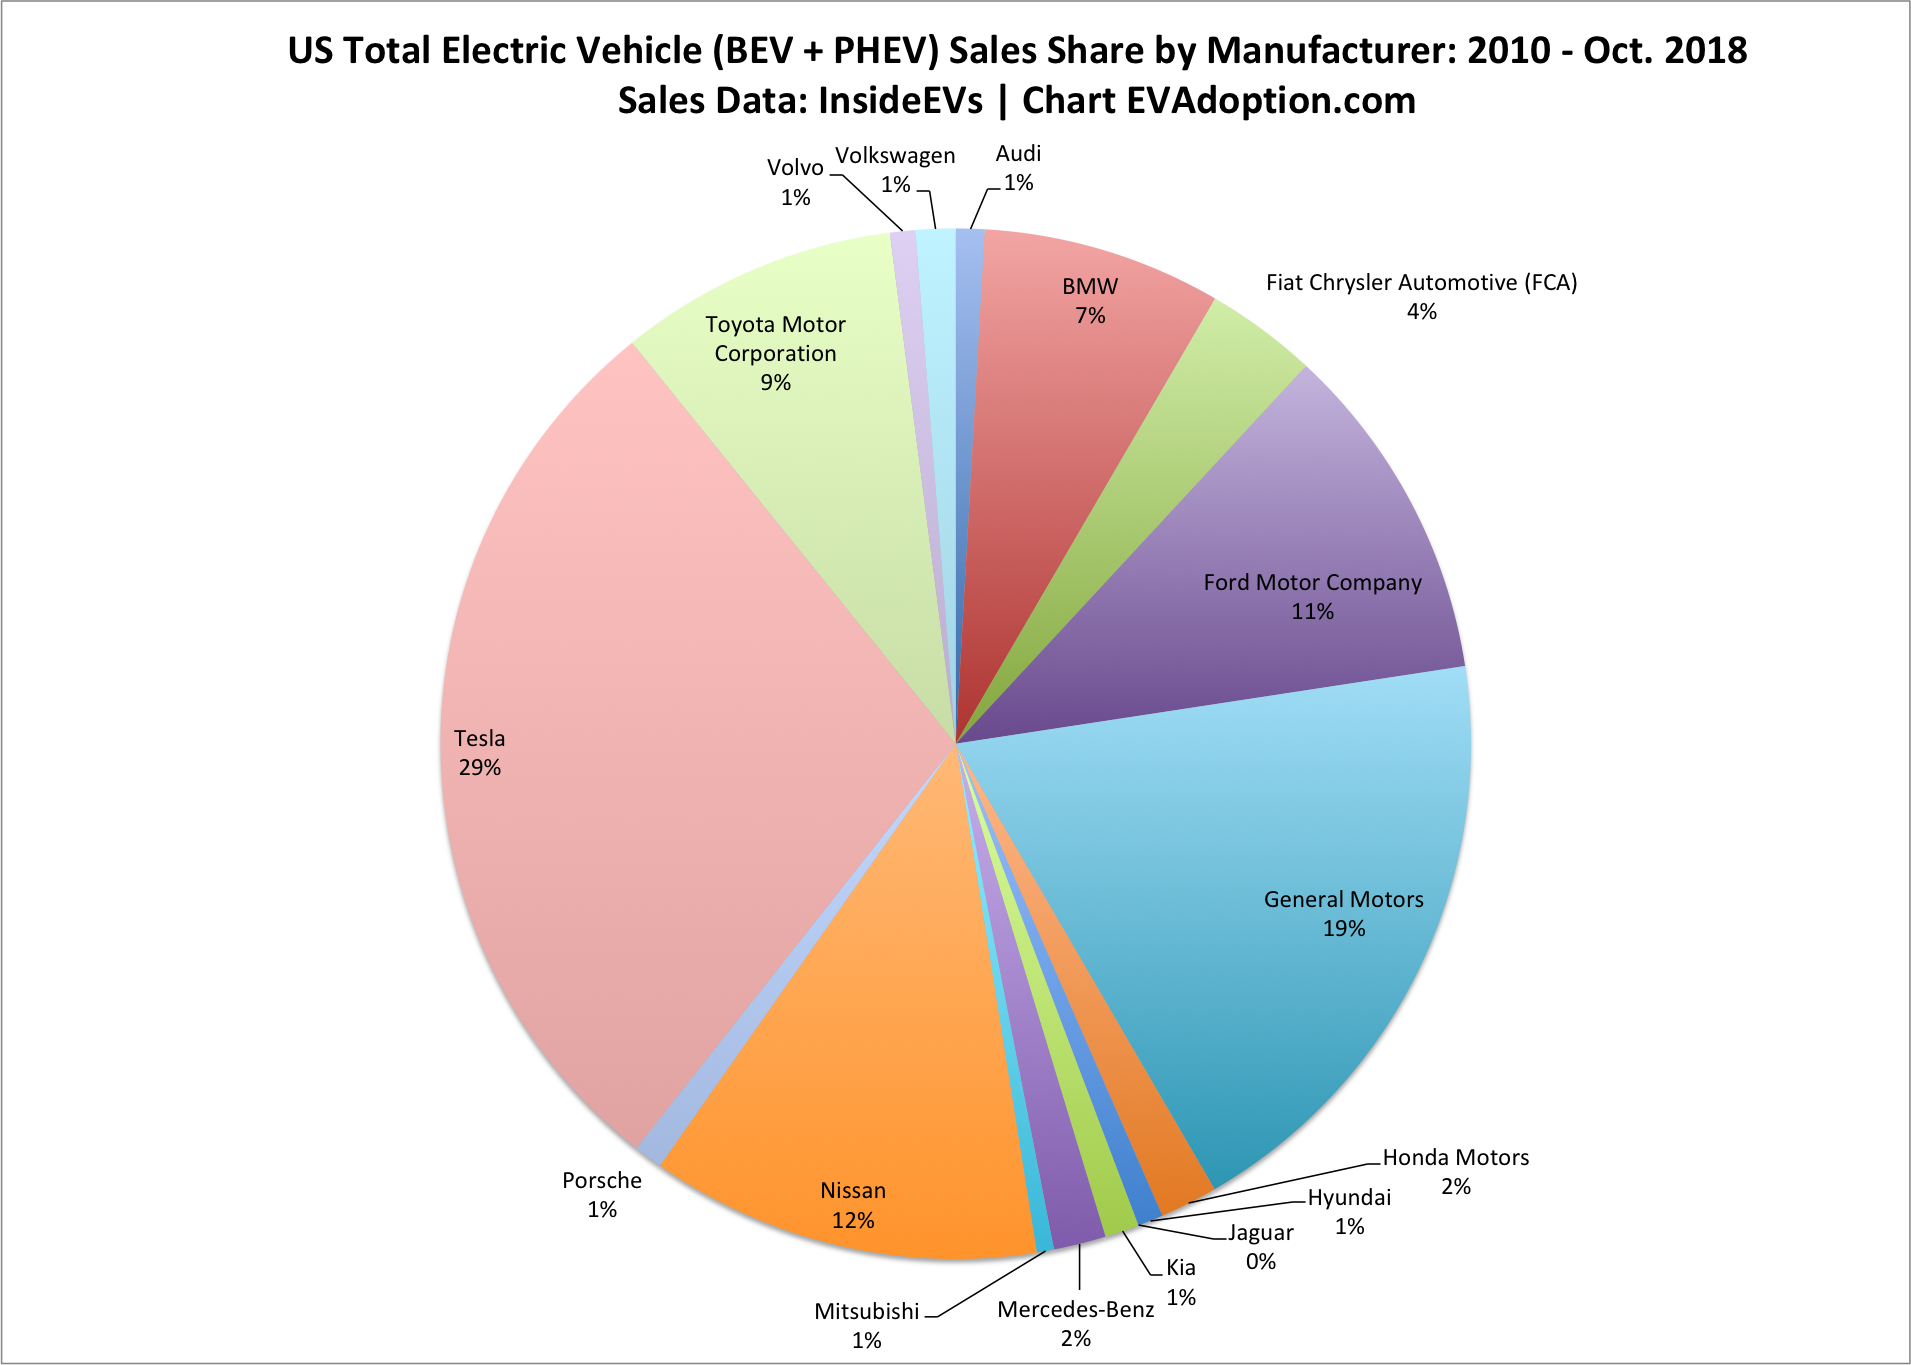
US Electric Vehicles 2018 Sales Statistics from EVAdoption
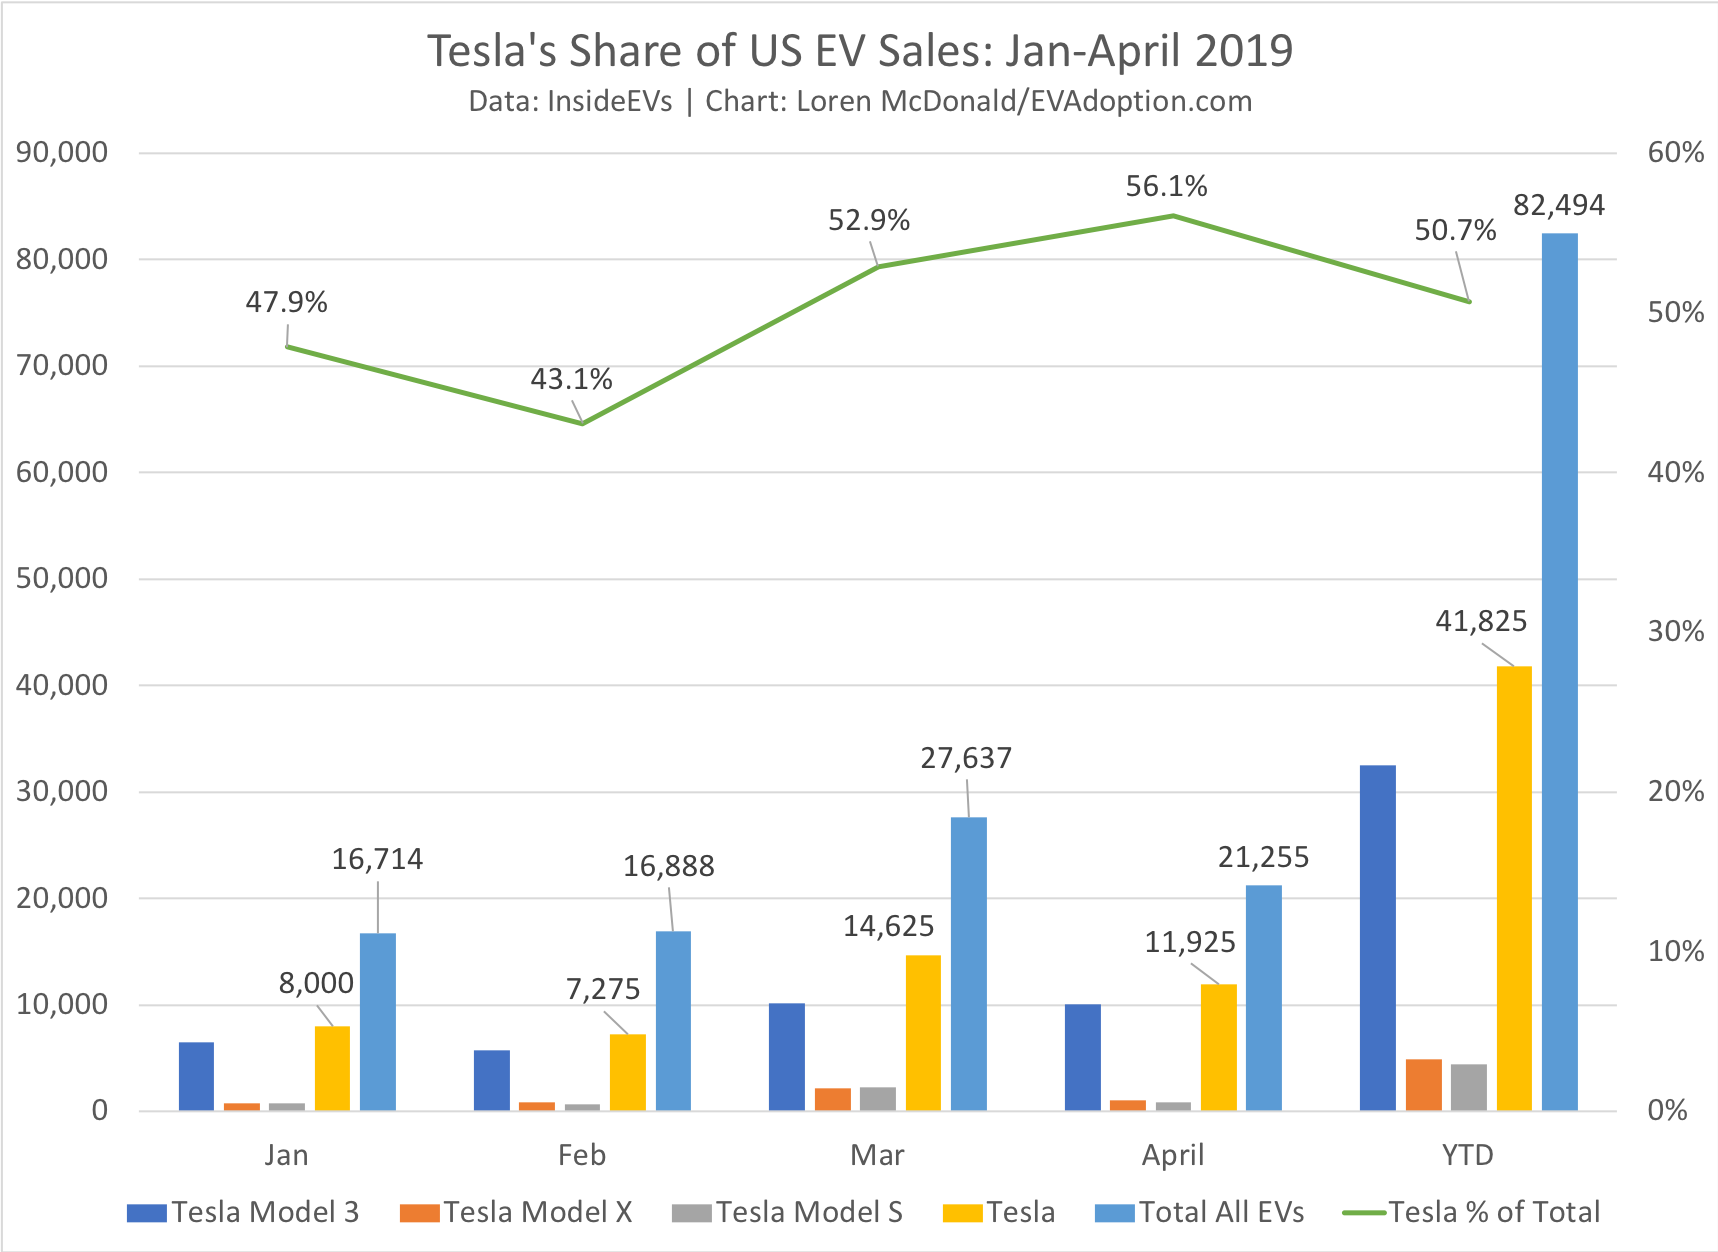
Tesla continues to account for +/- 50% of US EV sales, but reached 56.1% in April, but a low of 43.1% in February. YTD Tesla averaging a 50.7% share of sales. While nice bragging rights for Tesla and its fans, this is not a good trend overall as it means that the US EV market is still fundamentally being drive by one manufacturer that only produces electric vehicles.
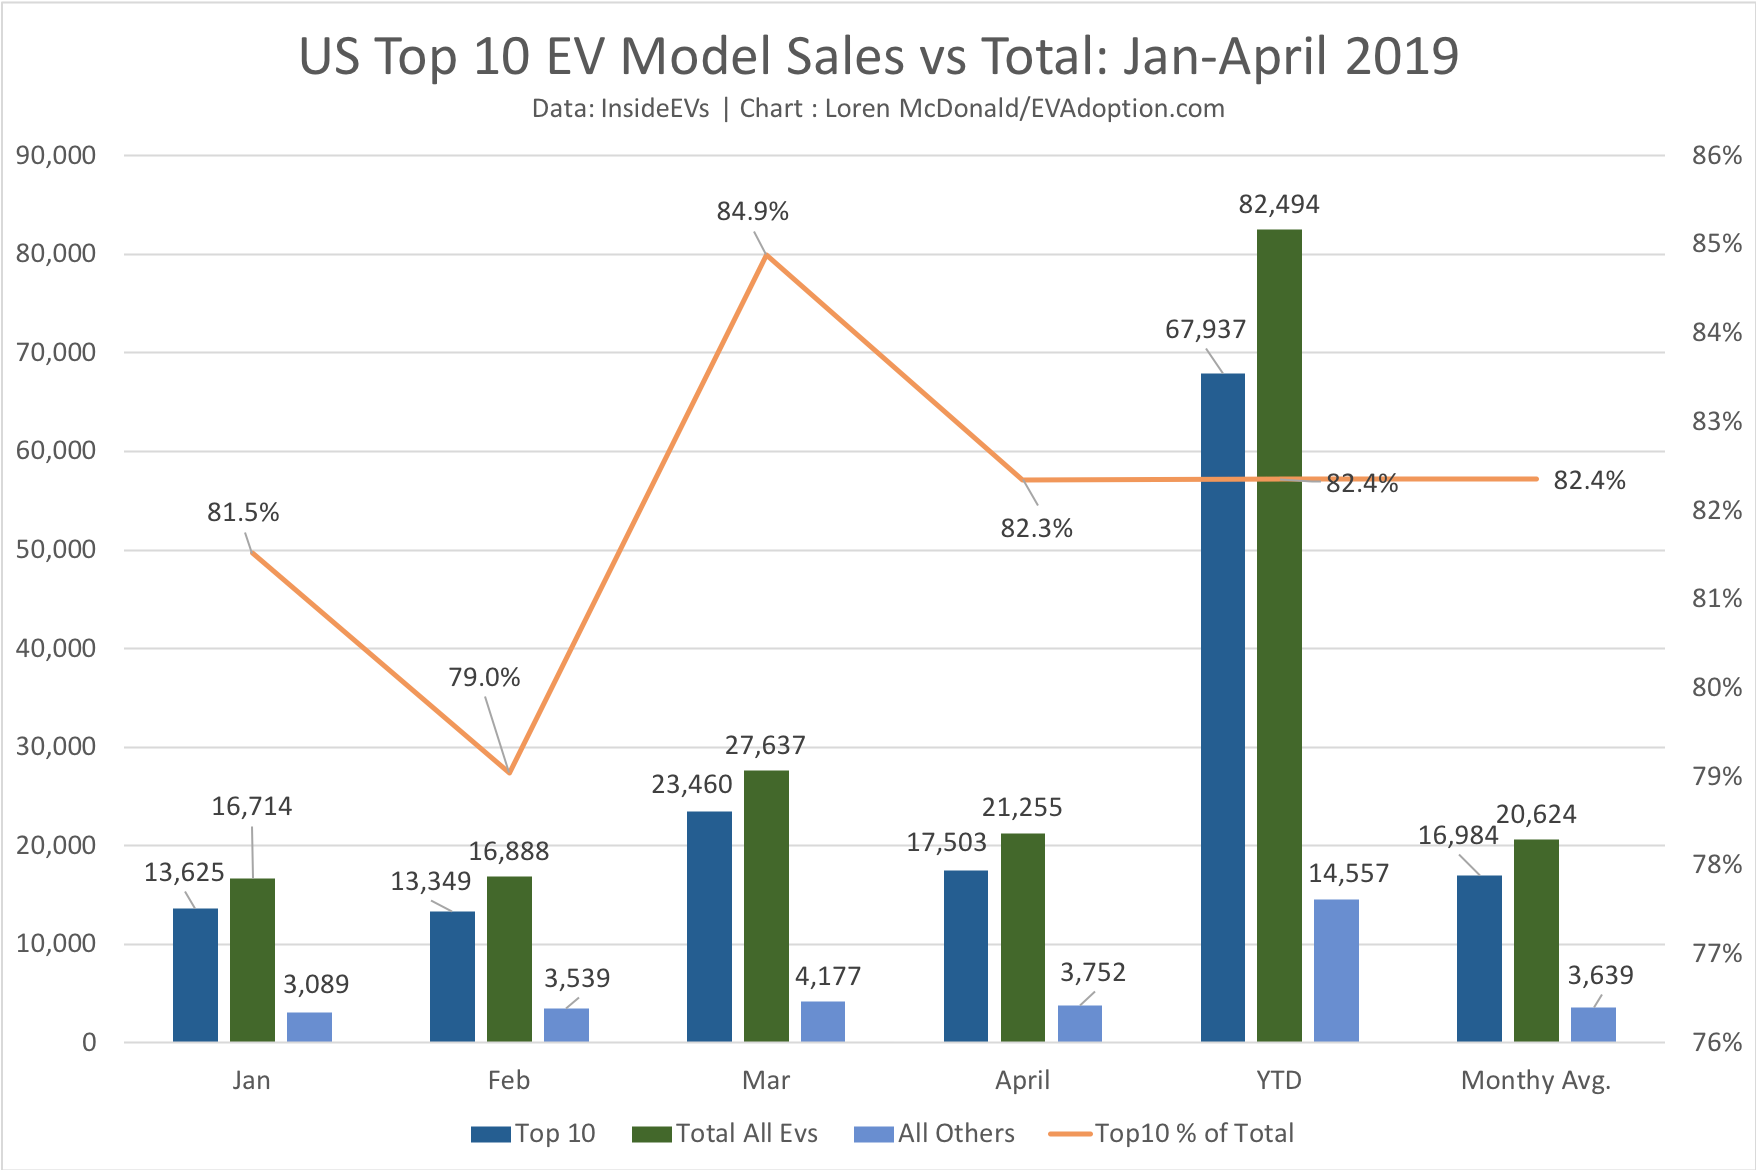
The Pareto Principle (“80/20 rule”) trend continues in the US with the top 10 selling EVs accounting for 82.4% of YTD sales out of 45 models now available.
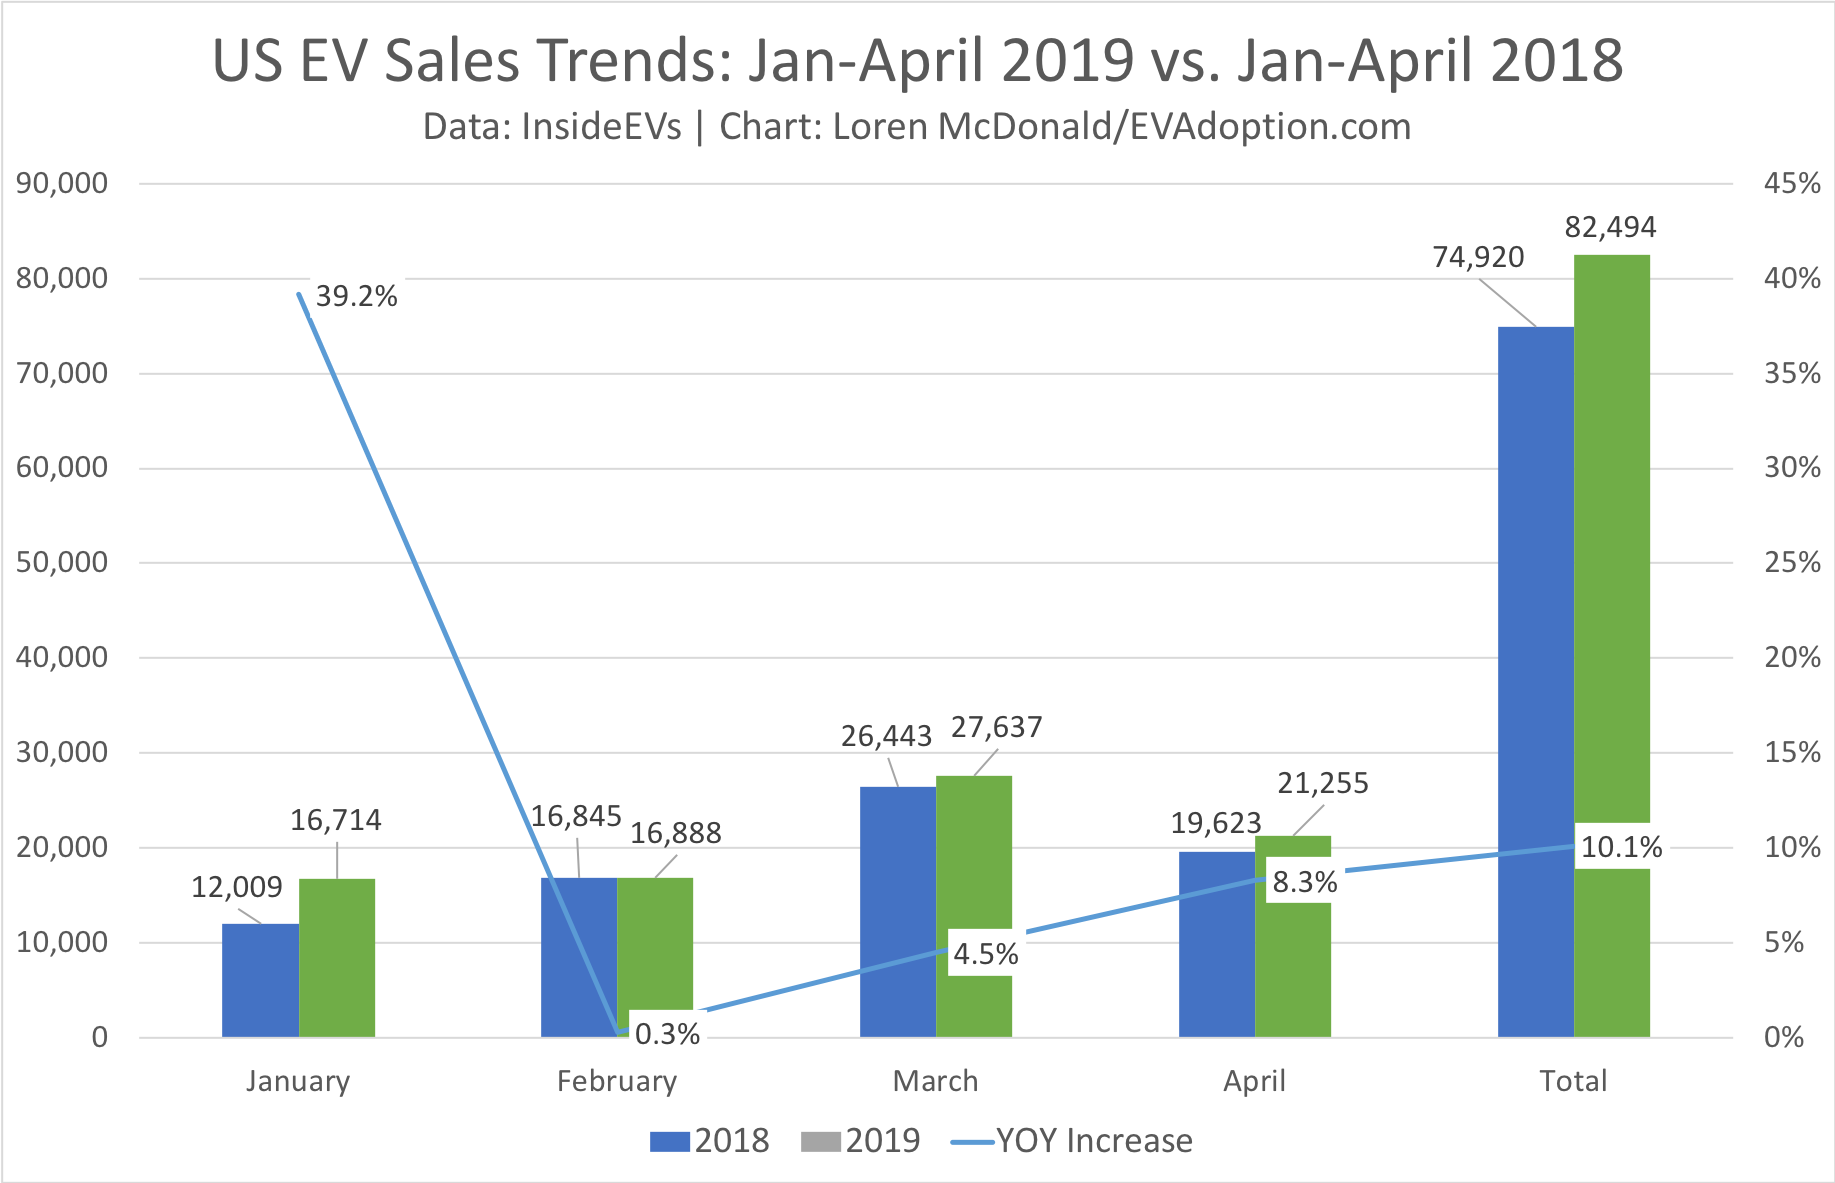
Through the month of April 2019, US EV sales are up 10.1% over the same period in 2018. April sales increased 8.3% over April of 2018.
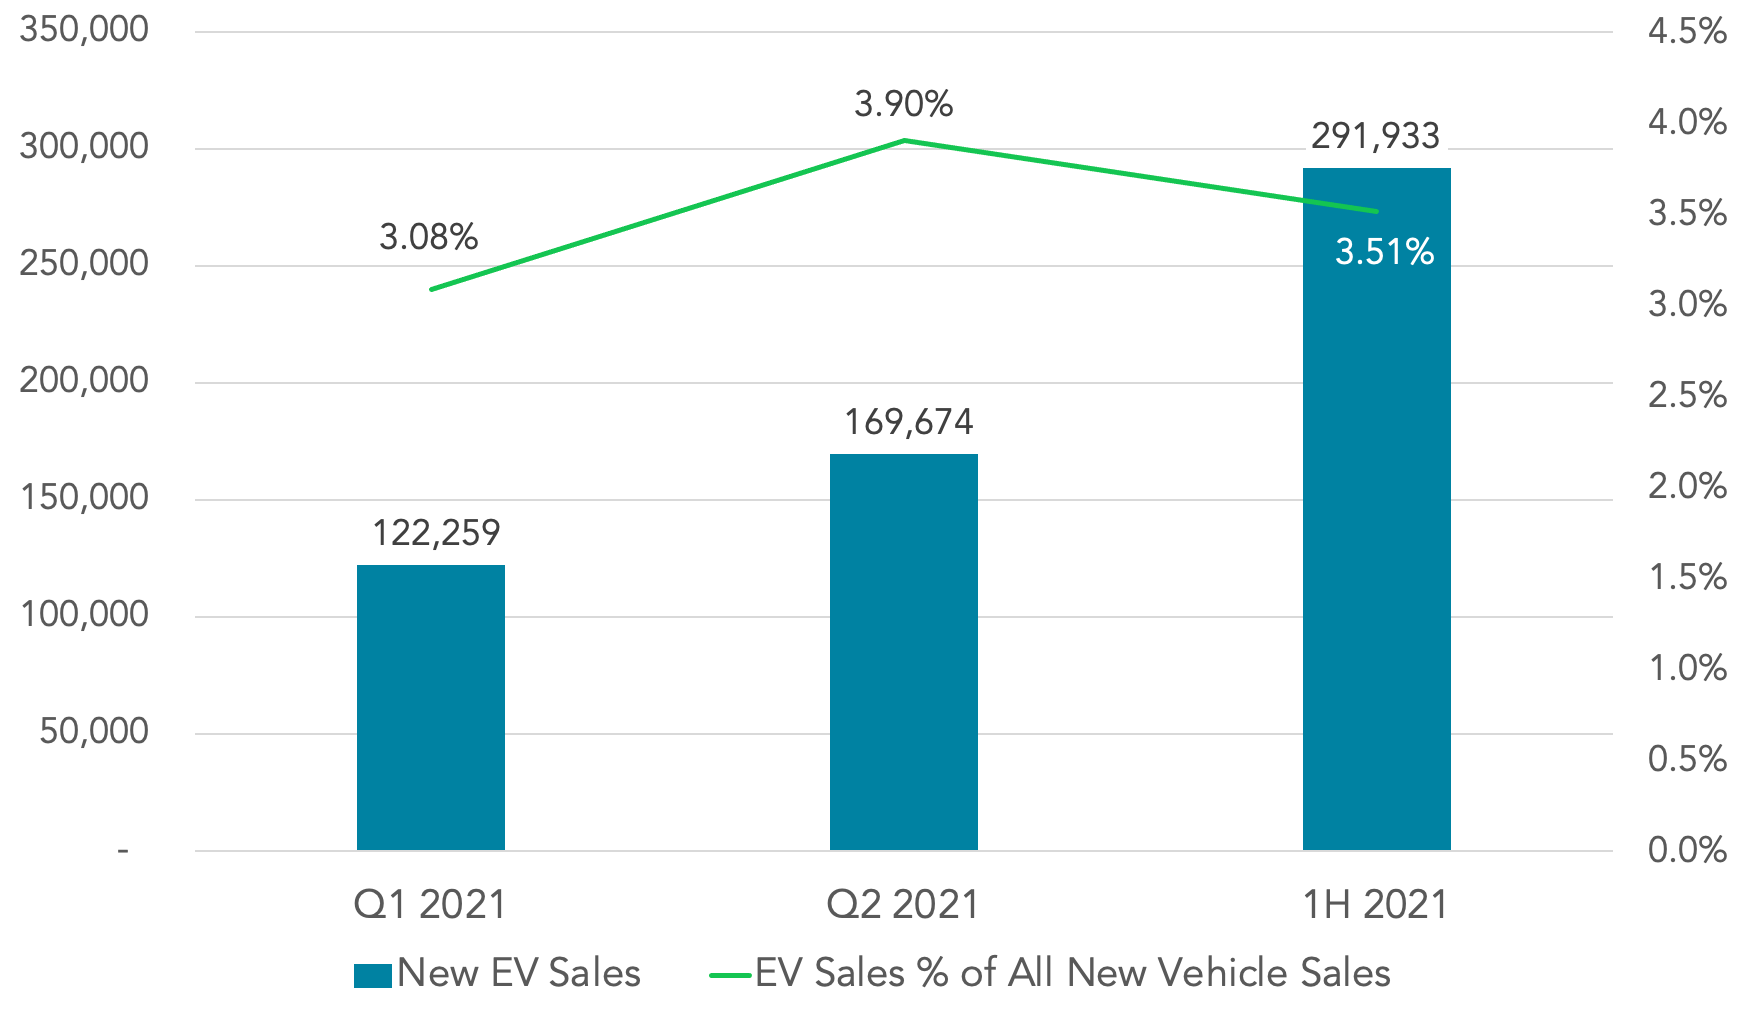
Despite the continued global chip shortage and lingering concerns and uncertainty about the Coronavirus pandemic, the first half of 2021 saw record sales of electric vehicles, according to the just released EVAdoption report, US Electric Vehicle Sales Report: 1H 2021. From January 1 to June 30, 2021 an estimated 291,933 BEVs and PHEVs (plug-in electric vehicles) were purchased, roughly 30,000 below the 320,000 average for the full years of 2018-2020.