Does a greater number of electric vehicle models available at auto dealers/showrooms within a state have a significant affect on overall EV sales within that state? In short, the answer is “yes,” but other factors have an even greater impact sales.
Answering the above question was one among many I wanted to get answers to in our EVAdoption regression analysis project where we analyzed the significance of 30 wide-ranging variables and their correlation with the 2018 new EV sales percentage in all 50 US states and the District of Columbia.
Among 30 variables analyzed only 7 had a statistically significant correlation with EV sales share. And among the 7, the number of EV models available per state was the 5th most significant and followed median household income. (I will share details of the study findings and all 7 variables in future articles.)
As the 5th highest correlation the number of EV models are in fact hugely important to sales within a state or market. However I had expected that model availability might rank even higher. (See research background at the end of this article.)
It seems obvious, however, that if more EV models were available in a state, then of course that would lead to more consumer choice and options, more visibility of EVs and then ultimately more sales. But how much more?

Model Availability and Sales Share By Top and Bottom States
Only two states, California and Oregon, were determined to have all 43 EVs available in their state, followed by Massachusetts and New York with 41 and Maryland and New Jersey with 40.
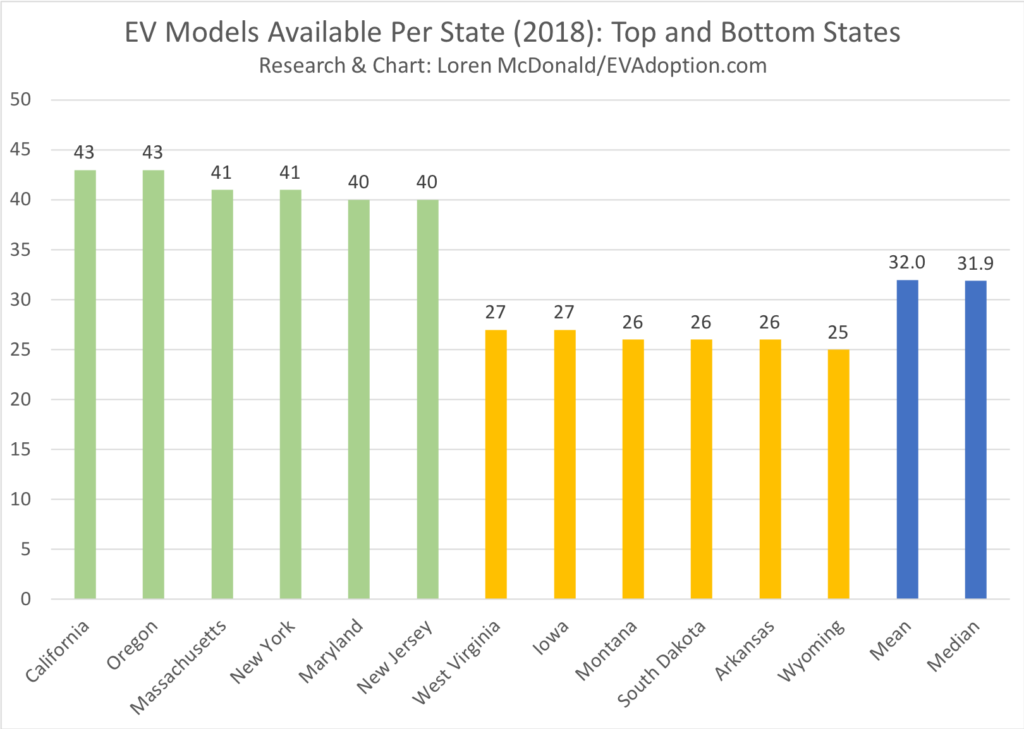
On the low end, Wyoming had the fewest EVs available with 25 and Montana, South Dakota and Arkansas only had 26 models available. The overall mean number of models is 32 and the median is 31.9.
Now let’s look at the top 10 states by EV sales share and overlay the number of models available in the states (chart below).
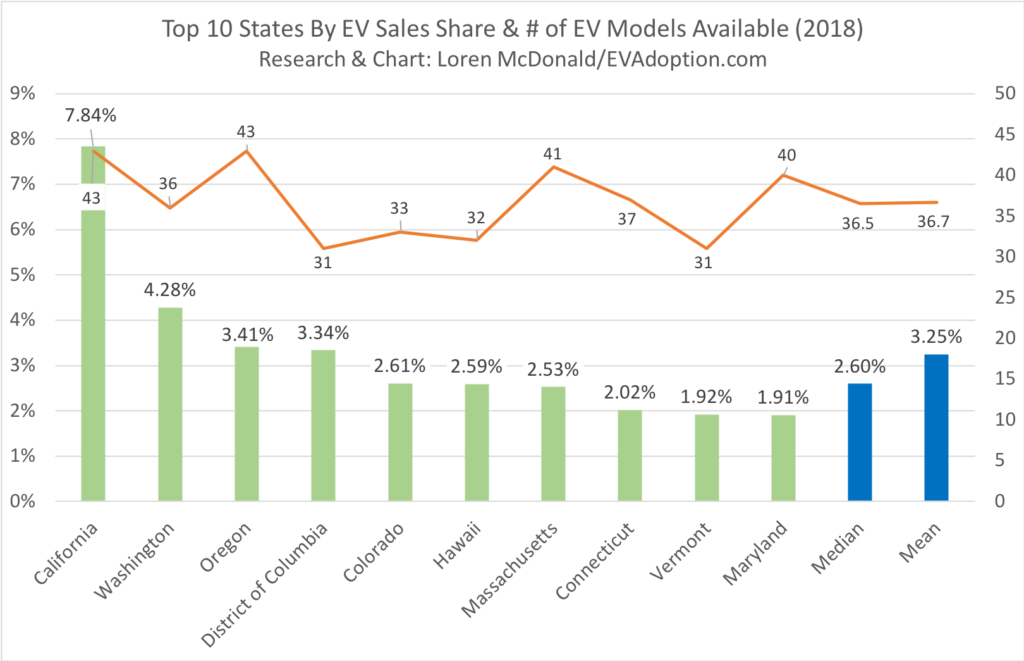
Of the top 10 states with highest EV sales share, all 10 had at least 31 EV models available in the state and 6 had 37 or more. For the top 10, the mean (36.7) and median (36.5) is well above the overall mean and median of 32.0 and 31.9 respectively.
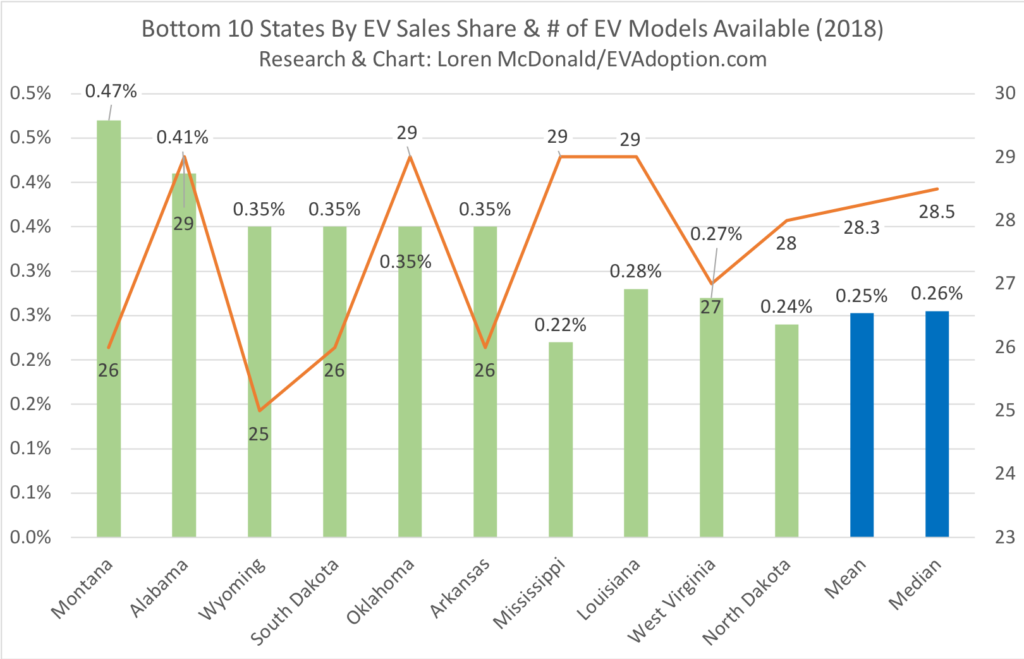
Looking at the bottom 10 states by EV sales share and we see that they all had 29 or fewer EVs available within the state. Five had 27 or fewer EVs available. For these bottom 10 states, the mean number of models was 28.3 and median 28.5.
Looking at the bottom 10 states by EV models NOT available in the state, the most common models not available were (with the number of states shown in (#)) and listed alphabetically):
- Fiat 500e (10)
- Ford Focus Electric (10)*
- Honda Clarity BEV (10)
- Hyundai IONIQ PHEV (10)
- Hyundai IONIQ BEV (10)
- Hyundai Sonata PHEV (10)
- Jaguar I-Pace (5)
- Kia Niro PHEV (10)
- Kia Soul BEV (10)
- Kia Optima PHEV (10)
- Mercedes-Benz B250e (10)
- Porsche Panamera 4 E-Hybrid/Turbo S E-Hybrid (5)
- Porsche Cayenne (5)
- Tesla Model 3 (10)
- Tesla Model S (10)
- Tesla Model X (10)
- Volkswagen e-Golf (10)
* Ford could not confirm availability of the Focus Electric, so this is an informed guess.
Lack of EV Model Availability – Chicken and the Egg
The lack of availability of the above EV models in multiple low EV sales states is clearly a key factor in limiting sales volume. Except for the Tesla models, most of the above EVs sell in low volumes across the US, so their individual impact is pretty low. But collectively there are significantly fewer options for consumers and with less variance in EVs in a market and fewer driving around and being visible, it has the effect of lowering overall awareness and demand.
With these low EV sales share states, there is a bit of a chicken and egg challenge. Many of these states are not going to be high EV adoption states due to demographics and psychographics. But it is very clear that states with a higher number of EV models available average an EV sales share of 10 times greater than those with many fewer models.
States with a higher number of EV models available average an EV sales share of 10 times greater than those with many fewer models.
The lack of Tesla showrooms and galleries in particular reduces awareness and interest in EVs. In turn with fewer Tesla models being purchased in those states, consumers see very few recognizable EVs in their towns and cities.
Tesla Showrooms and Galleries Are A Strong Driver of State Sales
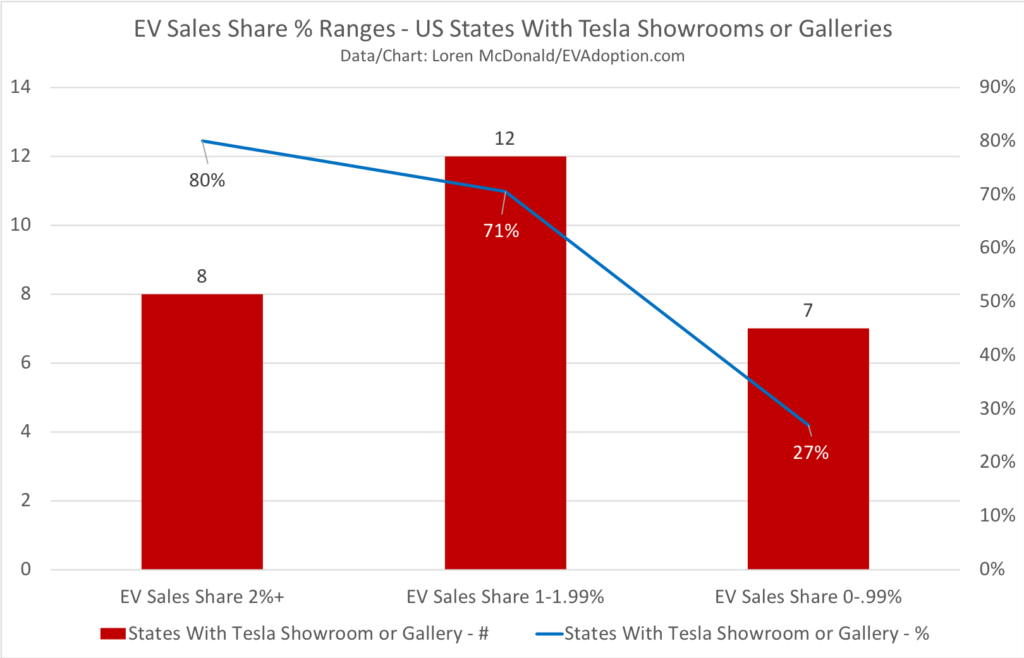
One interesting finding, is that none of the 10 states with the lowest EV sales share have a Tesla showroom or gallery in the state. With Tesla accounting for an estimated 53% of all US EV sales in 2018, it is therefore not a surprise at these states poor EV sales volume.
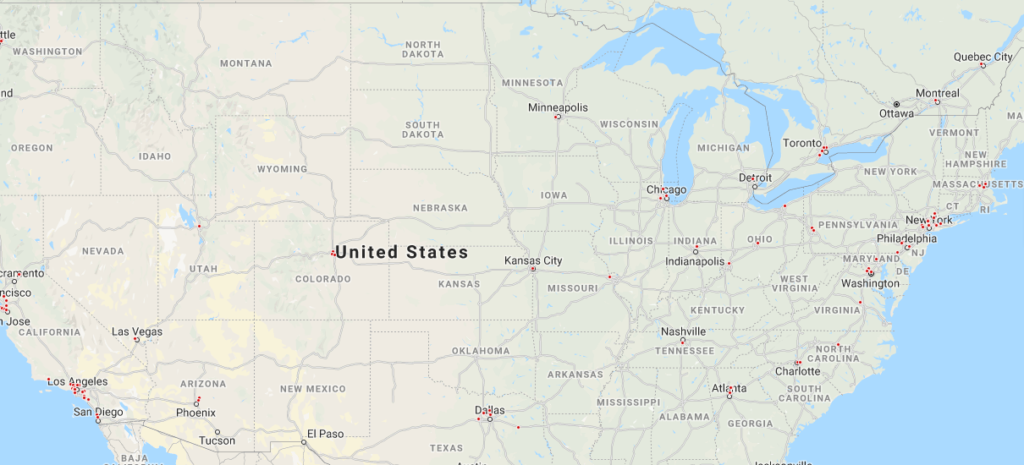
In looking at the presence of Tesla showrooms and galleries in a state (and Washington D.C.), the correlation with sales is pretty clear. Among the 10 states with an EV sales share of 2% or higher, 8 of them have a Tesla showroom or gallery. On the flip side, only 7 of the 26 states with EV sales share under 1% have a Tesla presence.
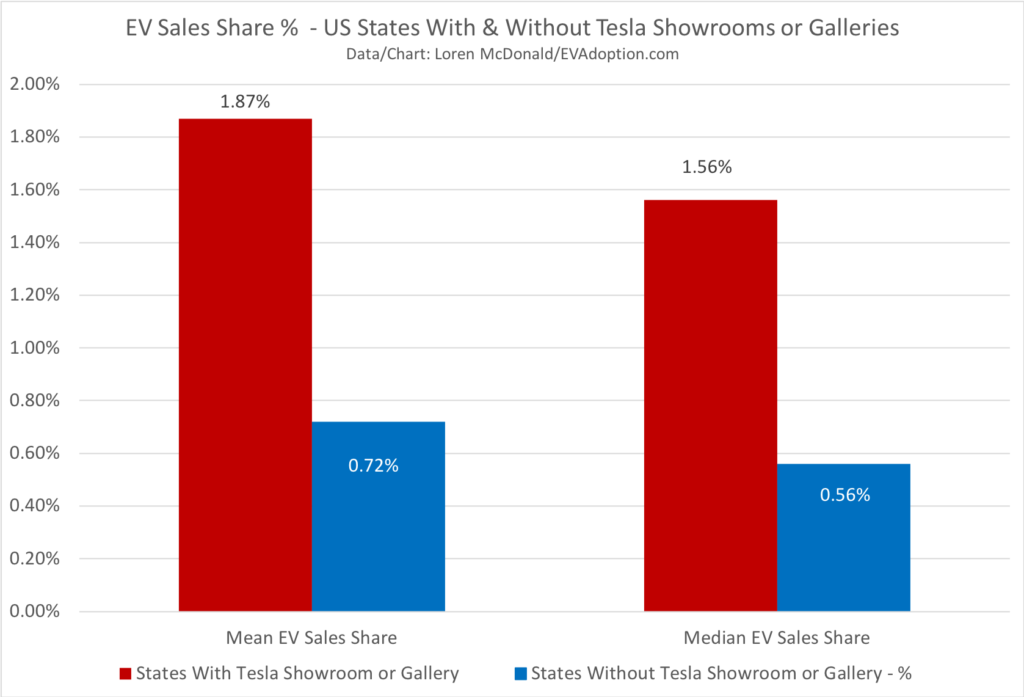
The mean EV sales share in states with a Tesla presence is 1.87%, more than 2.5 times the mean of 0.72% for non-Tesla states. States with a Tesla presence have a median of 1.56% sales share, 2.8 times the 0.56% of non-Tesla states.
Final Thoughts and Implications
It is clear and from our analysis that states with more EVs available generally also have a much higher share of EV sales in their state. The analysis on the impact from Tesla stores is particularly powerful.
Our regression analysis showed, however, that the number of EV models available was far from the most important variable in driving the level of EV sales. Those more significant factors include the price of gas, rate of solar installation, median household income, and percent of the grid’s electricity from renewable sources.
As such, the states that have a higher availability of EV models also tend to be those with higher gas prices, higher incomes, and more solar installations. This means that consumers will purchase EVs at a higher rate in those states regardless of the number of models available.
The automakers have also generally chosen to make their EVs available in states that at minimum are ZEV states which not surprisingly tend to also have higher gas prices and incomes, etc. But in our regression analysis, there actually was no statistically significant correlation between sales share and ZEV states or states with EV incentives.
The implications are simple. If automakers make their EVs available in a state, the shear fact of increased availability of EV models will obviously increase sales in that state. But the amount of increased sales will be primarily determined by the price of gas, ratio of solar installations, percent of grid’s electricity from renewable sources and household median income.
While we obviously encourage automakers to make their EVs available in all (or most of the) 50 states – until gas prices rise significantly, there are more model types (e.g., pickups, small affordable crossovers), EVs cost about the same as ICE vehicles, and the rate of solar installations increase – the EV sales share will remain relatively low in about 40 of the 50 US states.
In future articles we will share the findings of the EVAdoption regression analysis research and all 7 key correlations with EV sales share.
Background on Research and Determining EV Model Availability
As background, we researched availability on all 43 electric vehicles (both BEV and PHEV) that were available in the US in all or part of 2018 according to the InsideEVs Sales Scorecard. The Mercedes GLC 350e was available for only 11 months and the Jaguar I-Pace for 8 months. As such, for the regression analysis data, those two EVs were given values of 0.83 and 0.33 respectively, but for this article used a value of 1.
Additionally, we gave a 0.5 value to the Mercedes-Benz B250e as it was discontinued in 2018 and had a small level of sales throughout the year, but primarily in the first six months. Again, for the purpose of this article, it was also given a value of 1.
The 2018 EV sales share data was sourced from the Auto Alliance Advanced Technology Vehicle Sales Dashboard, using data provided by IHS Markit.
When we could not discern the state-level availability from the automakers’ websites, we reached out the media relations teams. In all we contacted 14 automakers, all of whom responded. In some cases they described their EVs as not being unavailable in any specific states, but at “participating dealers.” When precise availability could not be confirmed for a state, we included it if the automaker had a dealer in that state. Several automaker’s shared that EVs could be ordered from a dealer, even when none were in stock at a dealer. Similarly, for Tesla we used only the 27 states with a Tesla showroom or gallery.
