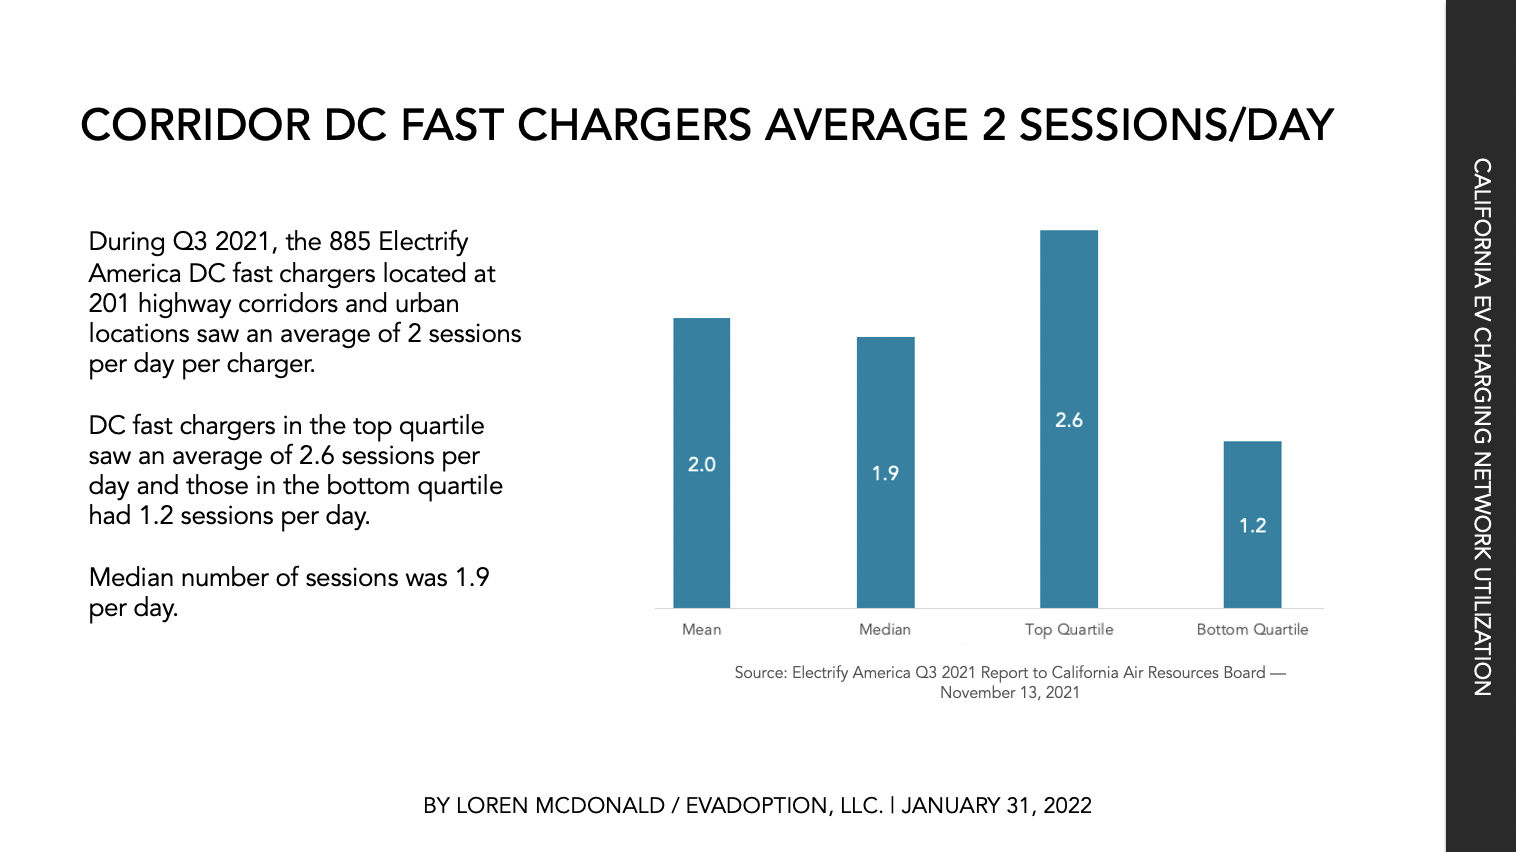
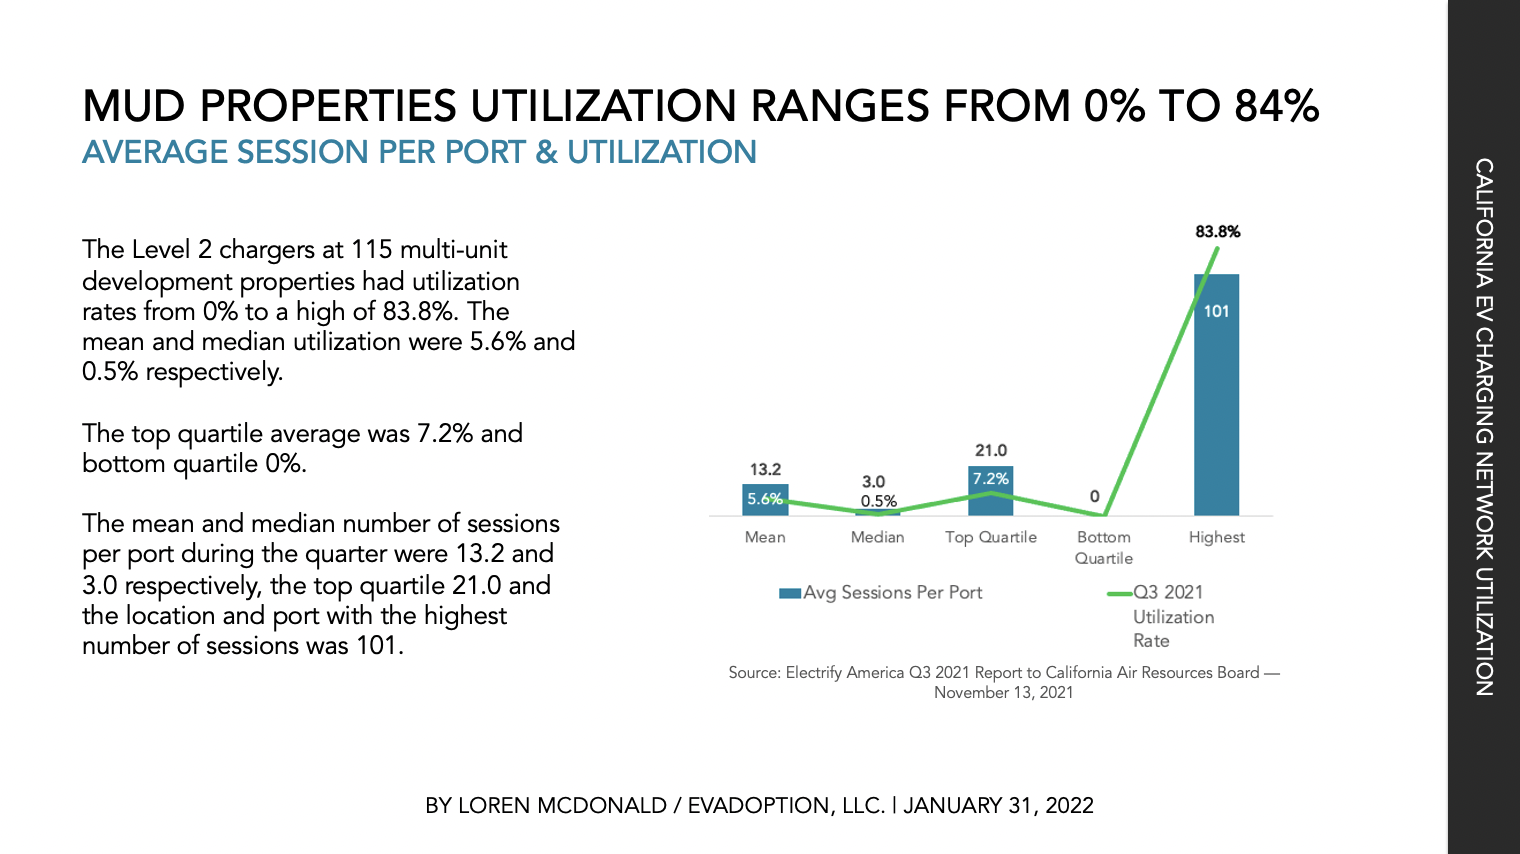
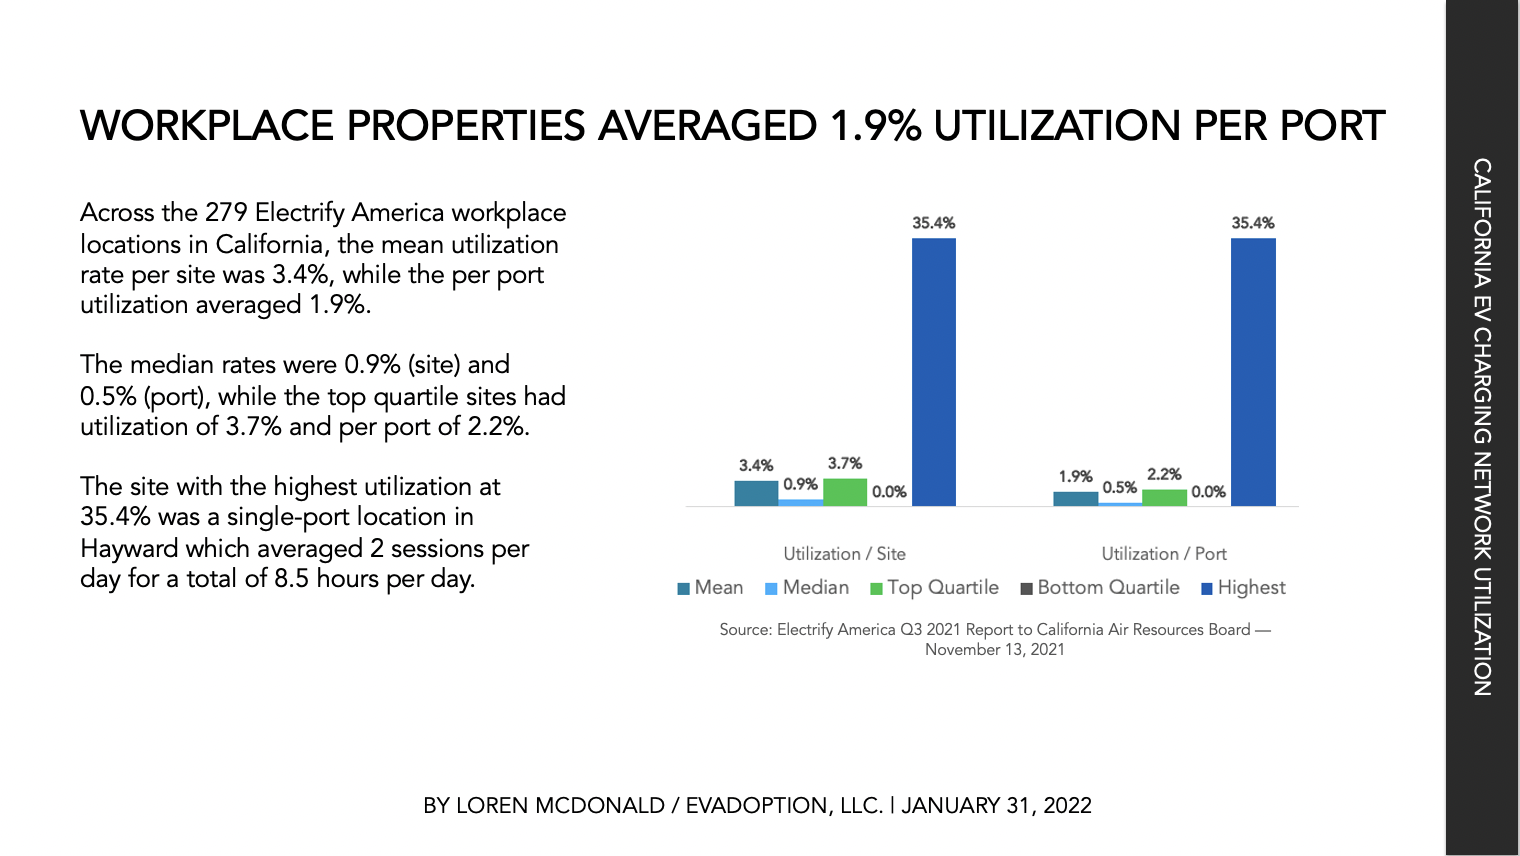
Most DC fast charging locations suffer from a combination of a high cost of deployment and a low number of daily charging sessions. As such, utilization — the percent of session time in a 24-hour period of individual chargers — has become a key metric to monitor the health of the industry and individual companies and charging locations. Unfortunately, the utilization metric is also generally a well-kept secret among the networks.
The one exception is Electrify America, which is required as part of Volkswagen’s diesel-gate scandal settlement to produce public reports outlining its progress toward commitments.
This report — based on data from Electrify America’s Q3 2021 California report — includes key findings, analysis, and 14 charts.
Purchasers of the report will also receive the raw data in an Excel file.
Have a question on the report before you buy, send us your question via our Contact form
The data and charts cover three charging use case/location types:
Charts and data included for each location type include:
And for most metrics, the data is presented as:
© 2024 EVAdoption, LLC | All Rights Reserved.